AI Tools for Multi-Brand Ghost Kitchens: What Actually Works
AI TOOL SELECTION FOR MULTI-BRAND VIRTUAL RESTAURANT OPERATORS: ORDER AGGREGATION AND KITCHEN DISPLAY SYSTEMS IN SHARED KITCHENS
You're running multiple restaurant brands from one kitchen, and your POS system is telling you everything is profitable. But you're bleeding money anyway. The problem isn't your work ethic or your menus — it's that single-brand tools were never built to show you what's actually happening when four brands share one inventory, one kitchen, and one set of delivery platform relationships. This report identifies where that money leaks and which tools can actually stop it.
Where Your Money's Actually Leaking
You have five invisible profit drains that standard restaurant reporting misses. First, platform commissions are eating margin at the order level, but your POS lumps them together so you don't know which brand or which platform is killing you. Second, your shared inventory is being consumed by your high-volume brands first, leaving your high-margin brands without stock and forcing you to turn away profitable orders. Third, your demand forecasting looks accurate overall — but it's useless by brand, so you're stocking for aggregate demand instead of the mix that makes money. Fourth, your labor routing and kitchen sequencing don't account for order profitability, so you're spending cook time on low-margin items while high-margin orders wait. Fifth, your brand promotions are cannibalizing each other without visibility: you run a discount on Brand A, but you're actually pulling customers from Brand B, shrinking total margin without knowing it happened.
The core trap is this: generic restaurant tools give you numbers that look accurate and feel wrong because they are. Your overall kitchen numbers might show 30% food cost, but Brand A is actually at 28% and Brand B is at 34%. Your platform commissions might average 18%, but they range from 12% to 26% depending on the delivery app. Your inventory management looks clean until you realize your fastest-moving brand has reserved stock that your highest-margin brand needs. These gaps don't show up as red flags. They show up as mysterious margin leakage that accounting can't explain.
The Tools That Actually Fit Multi-Brand Virtual Restaurant Operators (Ghost Kitchens)
If you're running two to four brands and your main problem is that you can't see order-level profitability across platforms, start with Deliverect. It aggregates orders from all your delivery platforms into one feed and surfaces platform commissions so you can see which platforms are actually costing you money. This alone will tell you whether you're right to panic about margin or whether the problem is specific to one or two platforms.
If you're running four or more brands and inventory cannibalization is your main leak, pair Deliverect with MarketMan. MarketMan is built for ghost kitchens specifically and lets you set profit-weighted stock reservations by brand. This means your high-margin brand gets first claim on limited inventory, and you stop losing money by serving low-margin volume at the expense of high-margin scarcity. Toast KDS and Deliverect's KDS module both handle multi-brand kitchen sequencing better than generic single-brand systems, though neither yet uses AI to intelligently sequence orders by both margin and station bottleneck at the same time.
One critical note: if you're still making platform mix decisions, promotion calendars, and inventory plans in separate silos with separate spreadsheets, no tool will fix that until the process is aligned. Tools surface problems; they don't solve broken operations.
The implementation sequence, the specific configuration traps for each tool in a multi-brand environment, and the risk matrix for deploying them together are in the full report.
- Every tool named and evaluated — Deliverect, MarketMan, Toast KDS, klikit
- Which tools fit Multi-brand virtual restaurant operators (ghost kitchens) specifically and which quietly fail
- The compliance traps and implementation risks specific to your slice
- A sequenced recommendation — what to buy first, what to wait on, what to avoid
- Confidence ratings on every finding so you know what's solid
Delivered as a PDF immediately after purchase. No subscription. No upsell.
Causal Relationship Graph
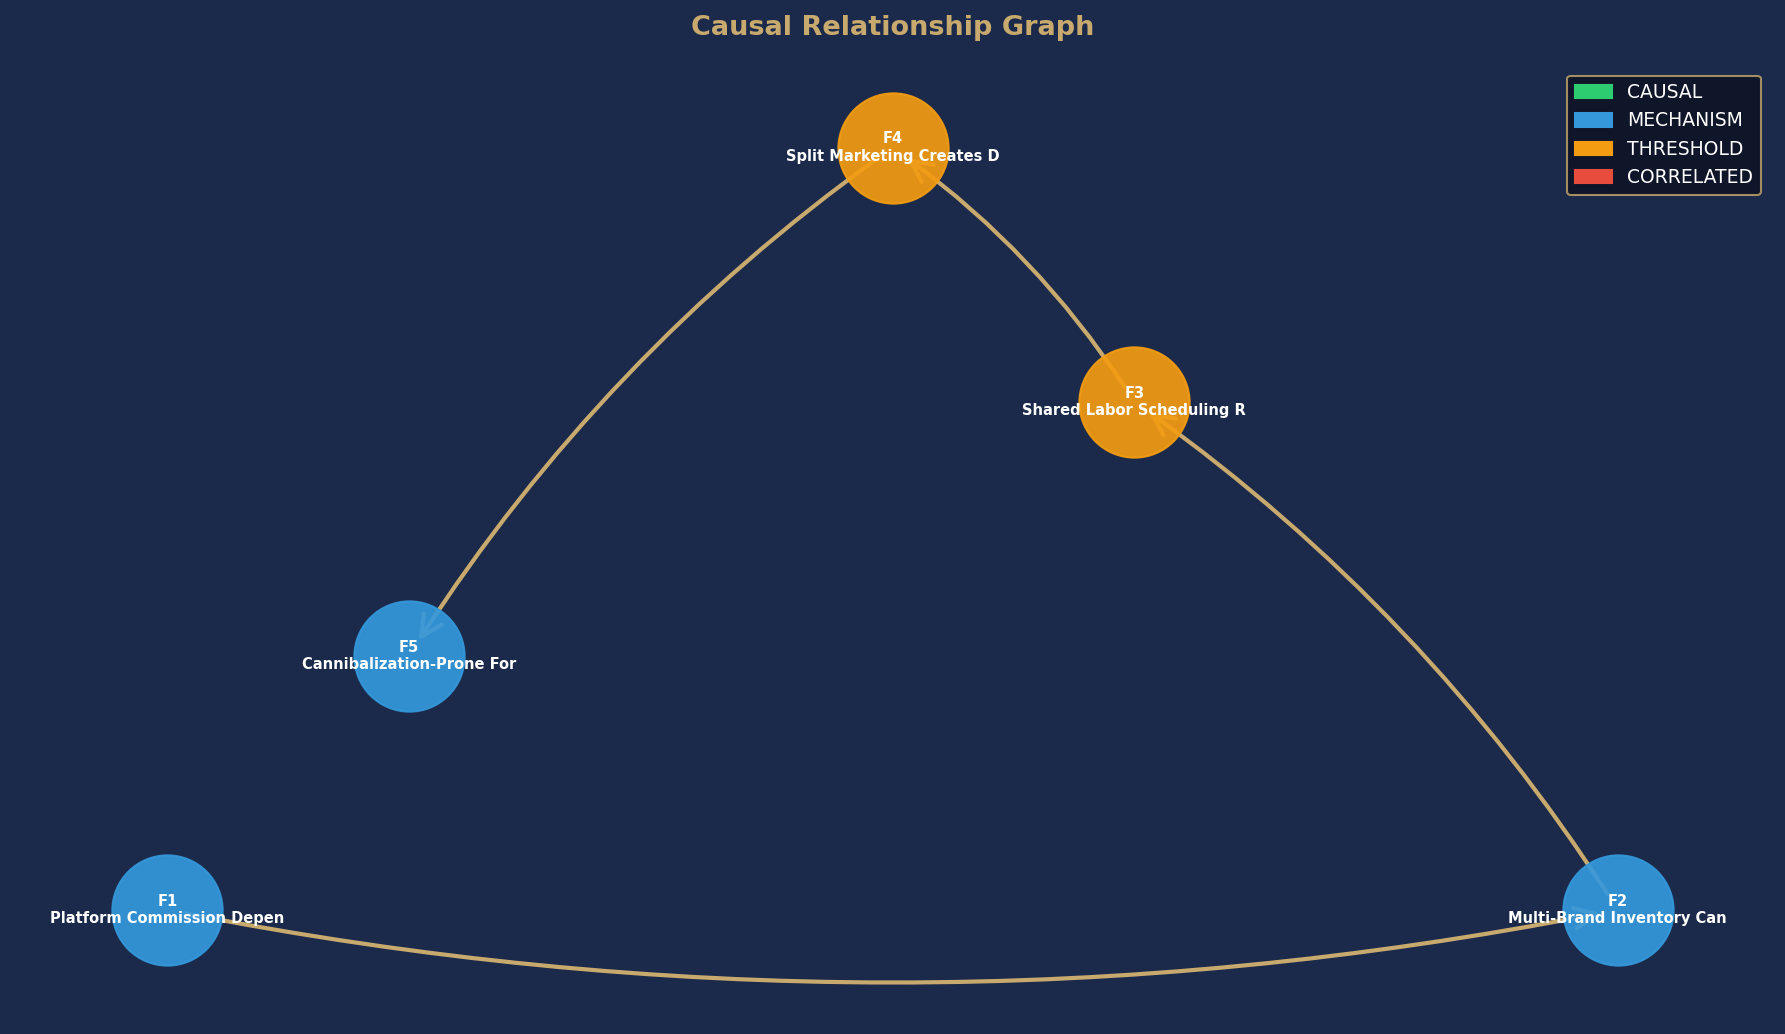
Node colors indicate causal confidence rating. Arrows show directional causal relationships identified in this analysis.
- Every AI tool named and evaluated — not placeholders, actual product names
- Which tools fit Restaurants specifically and which ones quietly fail
- The compliance traps and implementation risks specific to your practice area
- Conditional recommendations — which tool fits your specific operation and why
- Confidence ratings on every finding so you know what's solid and what needs validation
Delivered as a PDF immediately after purchase. No subscription. No upsell.
Full report PDF emailed to you immediately after purchase.