COMMODITY COUPLING FRAGILITY IN THE MAY 2026 IRAN NEGOTIATIONS WINDOW: HOW LOGISTICS CONSTRAINTS AND FERTILIZER DEPENDENCIES CREATE AGRICULTURAL LAG EFFECTS MARKETS HAVE NOT PRICED
IMPORTANT DISCLAIMER
This report is published by Novo Navis, LLC for general informational purposes only. It does not constitute financial advice, investment advice, legal advice, or any other professional advice. Nothing in this report should be construed as a recommendation to buy, sell, or hold any security, make any investment decision, or take any specific action.
The analysis contained in this report reflects information available as of May 2026. Market conditions, competitive dynamics, regulatory environments, and other factors can change rapidly. Novo Navis makes no representation that the information contained herein is accurate, complete, or current after the date of publication.
Always seek the advice of a qualified financial advisor, attorney, or other licensed professional before making decisions based on information in this report. Past performance of any market, company, or strategy referenced herein is not indicative of future results.
Novo Navis, LLC and its affiliates accept no liability for any loss or damage arising from reliance on this report.
COMMODITY COUPLING FRAGILITY IN THE MAY 2026 IRAN NEGOTIATIONS WINDOW: HOW LOGISTICS CONSTRAINTS AND FERTILIZER DEPENDENCIES CREATE AGRICULTURAL LAG EFFECTS MARKETS HAVE NOT PRICED
Executive Summary
The non-obvious finding in this analysis is not that the Strait of Hormuz closure has disrupted fertilizer supply. Markets have partially priced that. The non-obvious finding is that three distinct fragility mechanisms are operating simultaneously, each with a different time horizon, and their interaction produces a yield depression outcome in Q3-Q4 2026 that current commodity futures pricing does not reflect. The yield loss can materialize even if the Strait re-opens and negotiations conclude successfully in June.
The first mechanism is logistical. Since February 28, 2026, shipping transits through the Strait of Hormuz have collapsed from approximately 103 daily vessels to near zero, placing roughly 16 million tonnes per year of fertilizer export volume at immediate risk. [3] [27] Iran alone accounts for 4.5 million tonnes of annual urea exports. [48] Fertilizer prices have more than doubled since closure. [42] The mechanism by which this translates into agricultural yield loss six to twelve months later is not simply scarcity: it is that alternative routing via the Cape of Good Hope adds 45 to 60 days and 20 to 35 percent in logistics costs, and the timing of that delay intersects badly with Northern Hemisphere spring planting windows that run from approximately May 15 through June 15. This finding carries a MECHANISM rating. Markets are pricing the immediate price spike, not the trajectory of inventory depletion through the July through September application windows for Southern Hemisphere crops and late-season Northern Hemisphere applications.
The second mechanism is financial, not physical. Farm bankruptcies rose 46 percent in 2025 to 315 Chapter 12 filings, with over two-thirds concentrated in the Midwest and Southeast. [78] Agricultural credit conditions entering 2026 were already stressed. [80] Under conditions of geopolitical uncertainty, lenders tighten input credit before farmers make May and June fertilizer application decisions. Farmers facing credit pressure reduce application rates preemptively, even when fertilizer is physically available at current elevated prices. This credit-driven under-application creates yield suppression that is partially, though not entirely, irreversible within a growing season. This finding also carries a MECHANISM rating. Importantly, mid-season side-dressing and foliar application exist as partial remedies, which constrains the degree of irreversibility.
The third mechanism is temporal and political. The Iran negotiations in May 2026 are converging on a memorandum of understanding, but even successful resolution requires a minimum of 25 to 40 days before first Iranian urea shipments could credibly depart, and another 14 to 21 days transit time before reaching key importing ports. [5] [1] That places realistic first-supply arrival in the range of June 20 to July 10, after peak Northern Hemisphere spring applications are complete. This is a THRESHOLD finding: the correlation between negotiation delay and application shortfalls is observable, but the precise causal chain from relief to supply arrival has too many operational uncertainties to rate higher.
The integrated risk is this: commodity futures markets, trading at the intersection of current spot scarcity and geopolitical risk premia, are not pricing the recursive coupling of these three mechanisms. A negotiated resolution in June does not undo May application decisions. A Strait reopening in July does not restore July yield potential for crops planted in May on sub-optimal fertility programs. The 6 to 12 month agricultural lag is structural, not contingent.
Actionable implication: Investors and agricultural supply chain operators need to price 2026 Northern Hemisphere harvest yield risk independently of whether Iran negotiations succeed. The yield-loss mechanism is partially in motion regardless of diplomatic outcome. Southern Hemisphere crops planted September through November face a different but overlapping risk depending on whether Strait normalization produces actual fertilizer availability by August.
Situation and Context
The geopolitical trigger for this analysis is the 2026 U.S.-Israel military operations against Iran and the subsequent closure of the Strait of Hormuz to nearly all commercial shipping beginning February 28, 2026. [56] [57] By early May 2026, U.S. and Iranian negotiators were reported to be close to a one-page memorandum of understanding that would declare an end to hostilities and initiate thirty days of detailed talks covering uranium enrichment limitations, sanctions relief, and Strait normalization. [5] Iran had positioned the Strait question as a prerequisite, demanding Hormuz normalization before more detailed nuclear negotiations. [10]
The sanctions architecture governing Iranian commodity exports remains the most complex in the OFAC system. [12] The U.S. Treasury's February and March 2026 actions expanded sanctions against Iranian oil networks and IRGC-linked energy operations. [18] [19] Iran's currency fell to record lows in late April 2026 as blockade and sanctions effects compounded. [20] The sanctions framework creates a legal barrier to Iranian fertilizer exports independent of Strait access: even if the Strait reopens, Iranian urea and ammonia cannot legally move to most Western markets without explicit sanctions relief and new export licensing.
The fertilizer dimension is what markets have most significantly underpriced. The Strait of Hormuz is not primarily an oil chokepoint in the context of agricultural supply chains. It is the single most consequential maritime passage for global fertilizer feedstock logistics, handling approximately half of global phosphate and potash feedstock exports daily. [27] Iran's seven urea production units, led by Pardis, Lordegan, and Shiraz facilities, represent annual capacity of approximately 9 million tonnes, with 4.5 million tonnes historically exported. [48] All of this is currently offline from global markets. Qatar, Saudi Arabia, and the UAE also route fertilizer exports through or adjacent to the Strait, compounding the volume at risk.
The disruption arrived at the worst possible timing for Northern Hemisphere agricultural systems. The Strait closure on February 28 preceded peak spring fertilizer application demand by approximately 75 days. [60] Farmers making fertilizer purchase and application decisions in April and May 2026 were doing so against a backdrop of prices more than double their February levels, acute uncertainty about June availability, and deteriorating credit conditions following a year of elevated farm bankruptcies. [86] [78] Spring 2026 planting surveys indicated that a meaningful share of American and Brazilian farmers were reporting reduced planned fertilizer application rates. [35] [64]
Alternative supply pathways exist but are constrained. Morocco's OCP Group, the world's largest phosphate producer, has been operating at capacity since late 2025. [31] Russia, despite its own sanctions exposure, has been restricting fertilizer exports as a geopolitical tool and faces parallel logistics constraints through Black Sea routing. [28] China reduced phosphate exports in late 2025 and early 2026, and countervailing duties imposed by the United States on Chinese phosphate remain in force. [73] The net effect is that the global fertilizer supply system entered the Strait crisis with minimal buffer capacity. [71] [72]
The May 2026 negotiations window is therefore not simply a geopolitical event that briefly affects oil prices. It is a decision point with a direct and physically constrained pathway to agricultural yields 6 to 12 months later. The lag structure is embedded in biological reality: crops planted in May and June are physiologically committed to a fertility program by approximately July. You cannot retroactively apply nitrogen to a corn plant after it has tasseled. The decisions being made now are partially irreversible.
The World Bank's April 2026 Commodity Markets Outlook described global agricultural markets as stabilizing but warned that persistent risks from input cost inflation and logistical disruption could undermine the stabilization thesis. [90] [39] S&P Global's March 2026 assessment of Asian fertilizer markets explicitly noted a disconnect between surging input costs and lagging crop prices, particularly for rice and wheat, suggesting that the transmission of input cost shocks to food prices is itself delayed. [38]
Causal Relationship Graph
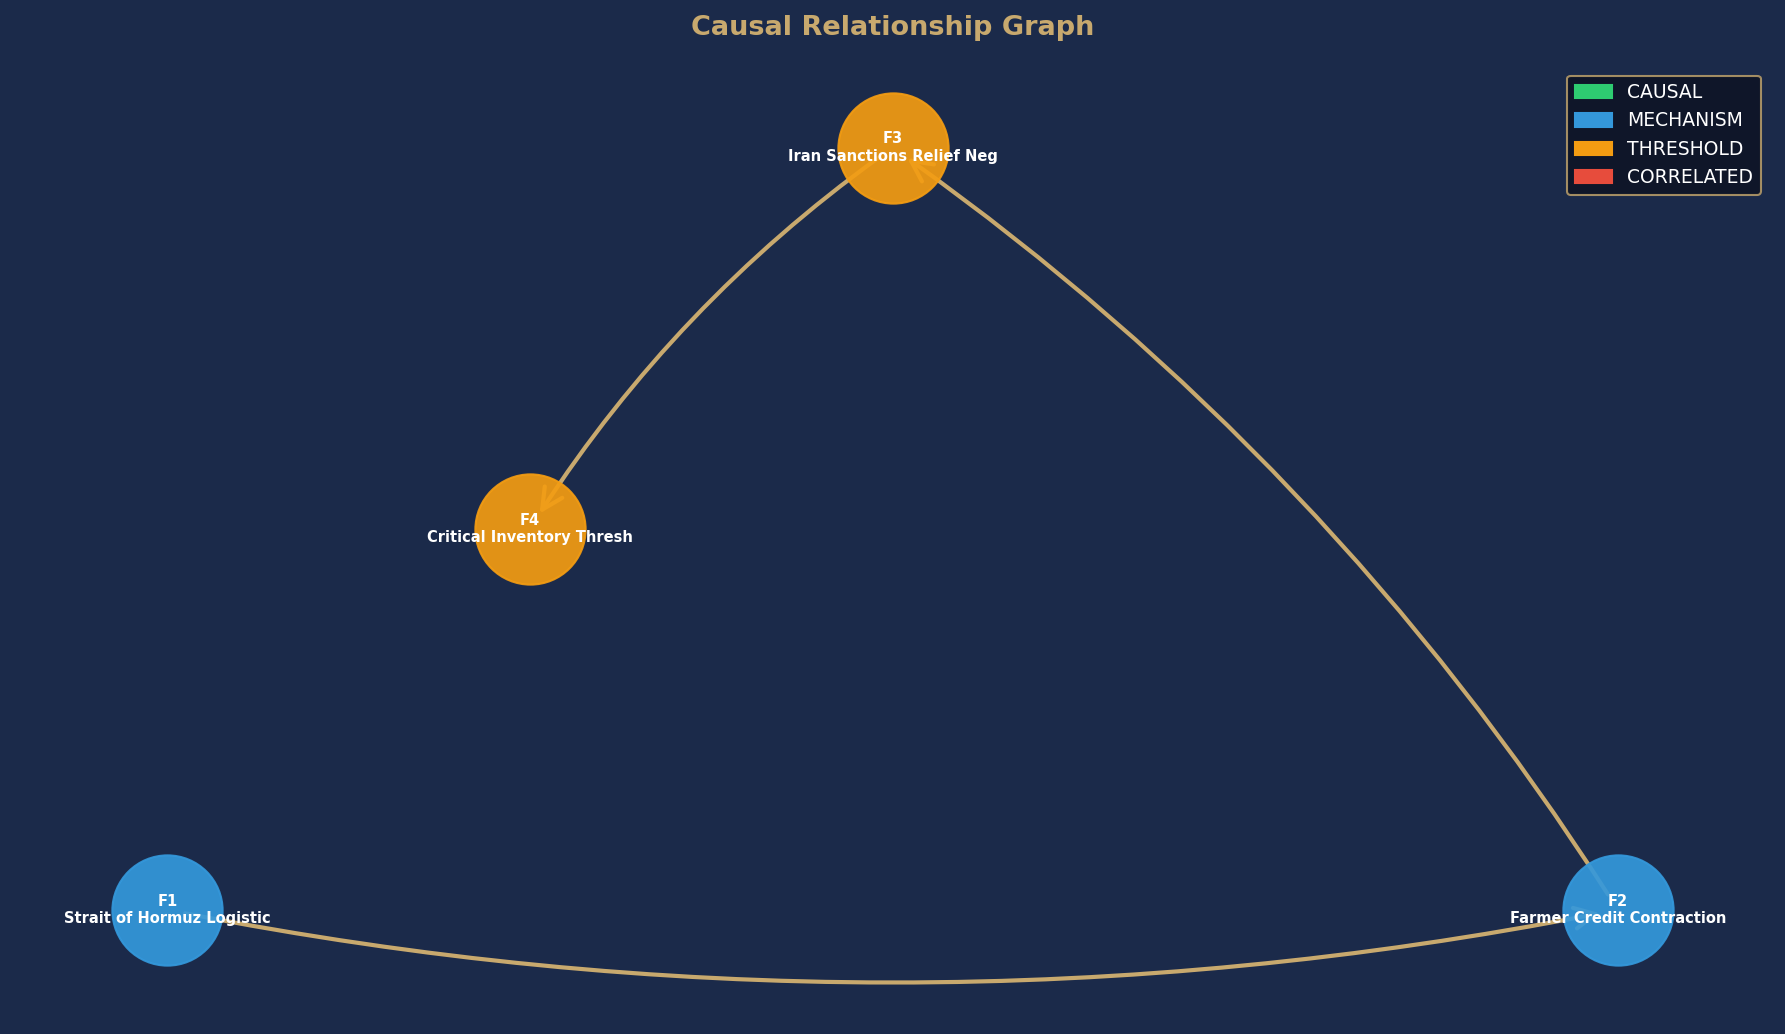
Node colors indicate causal confidence rating. Arrows show directional causal relationships identified in this analysis.
Causal Analysis, Who Benefits and Why, Key Risks, and What to Watch are available in the full report.
Get the full analysis.
The full report includes the complete causal analysis with confidence ratings, differentiated beneficiary assessment, key risks, and specific data points to watch. Delivered as a PDF immediately after purchase.