PERSIAN GULF SHIPPING DISRUPTION AND FREIGHT COST PASS-THROUGH: ASSESSING THE NON-LINEAR INFLATION TRANSMISSION MECHANISMS AND EQUITY ANALYST MODEL ADEQUACY FOR Q2-Q3 2026
IMPORTANT DISCLAIMER
This report is published by Novo Navis, LLC for general informational purposes only. It does not constitute financial advice, investment advice, legal advice, or any other professional advice. Nothing in this report should be construed as a recommendation to buy, sell, or hold any security, make any investment decision, or take any specific action.
The analysis contained in this report reflects information available as of May 2026. Market conditions, competitive dynamics, regulatory environments, and other factors can change rapidly. Novo Navis makes no representation that the information contained herein is accurate, complete, or current after the date of publication.
Always seek the advice of a qualified financial advisor, attorney, or other licensed professional before making decisions based on information in this report. Past performance of any market, company, or strategy referenced herein is not indicative of future results.
Novo Navis, LLC and its affiliates accept no liability for any loss or damage arising from reliance on this report.
PERSIAN GULF SHIPPING DISRUPTION AND FREIGHT COST PASS-THROUGH: ASSESSING THE NON-LINEAR INFLATION TRANSMISSION MECHANISMS AND EQUITY ANALYST MODEL ADEQUACY FOR Q2-Q3 2026
Executive Summary
The non-obvious finding in this report is not that the Strait of Hormuz closure has disrupted shipping — that is widely reported. The finding is that the dominant market narrative has the causal structure partially inverted: analysts and media coverage treat the Persian Gulf disruption as a broad inflationary shock to freight markets, when the actual mechanism is more localized and more complex than that framing allows, and the largest earnings risk to equity investors may not be elevated freight costs per se but rather the non-linear way those costs propagate through supply chains with heterogeneous contract structures, inventory turnover rates, and tier-to-tier working capital dependencies.
The Strait of Hormuz has been effectively closed to commercial shipping since late February 2026, operating at approximately five percent of pre-war traffic volumes. [46] Over 1,550 vessels have been stranded or rerouted, transit times on affected routes have extended by up to fourteen days, and spot freight rates on specific trade lanes have tripled from pre-crisis levels. [1][6] This is a genuine, material disruption. The question this report addresses is not whether the disruption happened but how it transmits into corporate earnings — and whether the equity analyst community has adequately modeled that transmission.
The answer to the second question is: probably not, but the inadequacy is more nuanced than a simple "analysts missed the freight spike." Three distinct analytical failures are identifiable.
First, the Persian Gulf closure creates a localized capacity bottleneck on specific trade lanes, not a systemic global freight market tightening. The global fleet is simultaneously undergoing its largest capacity expansion in years, with supply growing at 3.6 percent against demand growth of only 3.0 percent in 2026. [7][8] The Drewry World Container Index sat at $2,286 per forty-foot equivalent unit as of May 7, 2026 — elevated versus 2024 baselines but far below the 2021-2022 pandemic peaks. [72] These two forces — regional bottleneck and global supply glut — are competing, and analysts who model them as additive rather than partially offsetting are misestimating the direction of the earnings revision risk. Rating: MECHANISM.
Second, freight cost shocks propagate asymmetrically through supply chains depending on contract structure, inventory turnover, and working capital buffers. Firms locked into long-term fixed-price customer contracts signed in 2024-2025 cannot pass through elevated input costs until those contracts renew. Firms on spot-market pricing can pass through costs more quickly but face demand elasticity constraints that cap pass-through below 100 percent. The earnings miss risk is concentrated in sectors and firms with fixed-price customer obligations, particularly industrials, automotive supply chains, and consumer electronics assembly. Analyst sector-level guidance aggregates across this heterogeneity and will systematically misstate the timing and magnitude of margin compression. Rating: MECHANISM.
Third, the mechanism by which transit delays transmit into inflation is not simply "freight cost rises, input cost rises." It operates through working capital capitalization, where goods in transit for an additional fourteen days must be financed, and through tier-to-tier cost cascades in multi-stage supply chains involving semi-finished goods. These second and third-order amplification effects are structurally absent from standard sell-side COGS modeling approaches. Rating: MECHANISM.
The confidence ceiling across these findings is MECHANISM rather than CAUSAL because the critical Stage 3 evidence — published analyst model specifications showing assumed pass-through elasticities and freight cost inputs for Q2-Q3 2026 — is not available for direct audit. The analytical framework supporting these findings is empirically grounded, but the specific claim that analysts have systematically failed requires direct inspection of earnings model assumptions that are not captured in the available knowledge base. The findings should be treated as high-probability mechanisms warranting verification, not established causal facts.
The key action for investors: sector-level Q2-Q3 2026 earnings guidance from industrials, consumer discretionary, and manufacturing-heavy companies should be stress-tested for contract renewal timing and semi-finished goods inventory exposure before being accepted at face value.
Situation and Context
The 2026 Strait of Hormuz crisis began in late February following US and Israeli military strikes on Iran, which prompted Iran to blockade the strait in retaliation. [46] As of early May 2026, traffic through the strait was running at approximately five percent of pre-war average volumes. [46] Iran has established a "Persian Gulf Strait Authority" to vet commercial vessels seeking passage, and on May 7, Iran imposed new transit rules as part of diplomatic signaling following a temporary US pause in military operations. [47] The situation remains unresolved, and the Al Jazeera analysis as of late April 2026 found no credible timeline for return to normal commercial shipping conditions. [48]
The physical consequences are significant. Over 1,550 vessels have been stranded or diverted. [1] Ships that previously transited Hormuz to reach the Persian Gulf, Arabian Sea, or Suez Canal route have been forced onto alternative paths, with the most common rerouting adding approximately fourteen days of transit time. [2] A French container vessel was struck in the latest escalation incident as of May 6, 2026, underscoring that the risk environment remains kinetic, not merely procedural. [51]
The Strait of Hormuz carries approximately twenty percent of global seaborne oil and liquefied natural gas volumes under normal conditions, making it the most strategically critical maritime chokepoint in the world. [50] For containerized shipping, the strait is less dominant than for hydrocarbons — the primary container lanes affected are Asia-to-Gulf Cooperation Council trade, intra-regional Middle East routes, and traffic that would normally transit through Gulf ports before onward distribution. Asia-Europe container traffic primarily moves through the Suez Canal rather than Hormuz, meaning the disruption's direct impact on headline indices like the Shanghai Containerized Freight Index is more attenuated than media coverage sometimes implies.
As of May 13, 2026, the Containerized Freight Index was trading flat at 1,954.21 points, while the Drewry World Container Index increased three percent week-on-week to $2,286 per forty-foot equivalent unit, recovering after three consecutive weekly declines. [72][73] The Transpacific and Asia-Europe lanes drove that particular weekly move, suggesting that broader trade lane dynamics — including tariff front-running and demand timing effects — are influencing rates alongside the Gulf disruption. [3]
Critically, the freight rate environment entering 2026 was already structurally unusual. Analysts at Xeneta and Freightos expected rate declines of ten to twenty-five percent across different contract types for full-year 2026, driven by a mismatch between global fleet capacity growth (3.6 percent) and demand growth (3.0 percent). [7][8] This pre-existing capacity surplus is the structural backdrop against which the Persian Gulf disruption must be evaluated. The global fleet is not tight; it is loose, with the Persian Gulf closure creating localized congestion while excess capacity sits available on other trade lanes.
Diesel fuel prices surged in Q1 2026, rising from $3.72 to over $5.40 per gallon, creating a parallel fuel cost shock that affected land-side freight carriers independently of the Persian Gulf situation. [27] This means the cost pressure hitting corporates in Q2-Q3 2026 is a compound event: ocean freight disruption on specific trade lanes, fuel cost increases affecting trucking and last-mile delivery, and working capital pressure from extended transit times. These three vectors are analytically distinct but affect the same corporate income statement, creating a risk of underestimation when each is modeled separately.
Equity markets have broadly priced Q2 2026 with optimism. Analysts are projecting aggregate S&P 500 earnings growth of 19.9 percent and revenue growth of 11.2 percent for the quarter. [56] Consumer discretionary and industrials sectors are expected to contribute to that growth. The question this report examines is whether those sector-level projections adequately account for the freight cost mechanisms described above, or whether they reflect an analytical baseline set before the full structure of the Persian Gulf disruption's cost transmission became clear.
Causal Analysis
Finding 1: The Persian Gulf Disruption Creates a Localized, Not Systemic, Freight Cost Shock Rating: MECHANISM
The correlation is clearly established. Spot freight rates on routes affected by the Hormuz closure have tripled. Transit times on affected lanes have extended by fourteen days. Over 1,550 vessels have been disrupted. [1][2][6] The correlation between the blockade and rate elevation on affected trade lanes is unambiguous.
The mechanism is directionally clear. Iran's blockade restricts commercial access to the strait, forcing vessels onto longer alternative routes. The capacity previously deployed on shorter Hormuz-transiting routes must now serve longer voyages, temporarily reducing effective carrying capacity on affected trade lanes. Spot rates on those lanes rise in response. This is a textbook capacity bottleneck mechanism.
The critical mechanism-level complication is the simultaneous operation of a competing force. The global container fleet is expanding at 3.6 percent in 2026 against demand growth of only 3.0 percent. [7][8] This structural oversupply creates a ceiling on how much the localized bottleneck can push global rates. Vessels not deployed on affected Gulf routes are available for redeployment on other trade lanes, absorbing demand displacement and preventing the regional shock from metastasizing into a global freight market tightening.
This is why the Drewry World Container Index, despite the Hormuz closure being nearly three months old, was only at $2,286 per forty-foot equivalent unit as of May 7, 2026 — elevated compared to the subdued 2024 baselines but nowhere near the $11,000-plus levels seen during the 2021-2022 pandemic crunch. [72] The global fleet glut is acting as a partial shock absorber.
However, the finding cannot be rated CAUSAL because the Stage 3 evidence is forward-looking rather than empirically validated. Forecasts of ten to twenty-five percent rate declines by Q3 2026 are projections, not retrospective proof that the fleet glut mechanism is already dominating the bottleneck mechanism. [7] The rates as of May 2026 remain ambiguous — the three percent weekly increase in the WCI could reflect bottleneck pressure re-asserting itself, or it could reflect unrelated demand-side factors on Transpacific lanes. [72]
The critical confound that prevents a CAUSAL rating is geographic mismatch. Spare capacity sitting on Transpacific or intra-Asian routes does not automatically relieve pressure on Asia-Europe or Asia-Gulf lanes. If the vessels with the right configurations and scheduling positions to serve those specific routes are not available as substitutes, the regional bottleneck may persist even if aggregate global capacity appears ample. The knowledge base does not provide the granular vessel-type and trade-lane-specific capacity data needed to validate that substitution is actually occurring at scale.
Analytical implication: Companies with significant Asia-to-Gulf-Cooperation-Council sourcing or distribution face genuinely elevated freight costs on those specific routes, while companies whose primary exposure is on Transpacific or intra-Asian lanes face a more complex picture where rate direction is contested between bottleneck effects and overcapacity.
Finding 2: Contract-Rate Versus Spot-Rate Exposure Creates Asymmetric Earnings Impact Across the Corporate Universe Rating: MECHANISM
The structural difference between firms operating on long-term fixed-price shipping contracts versus spot market exposure is a genuine source of earnings impact heterogeneity. This is not a novel theoretical claim; it is documented in procurement economics and supply chain finance literature. [14][81][82]
The correlation is that freight cost shocks produce unequal earnings outcomes across firms in the same sector. The mechanism operates through contract structure. Firms that locked in annual or multi-year shipping contracts at 2024-2025 rates — when the market was softer — have their freight costs hedged for the contract duration. They are partially insulated from the spot rate spikes caused by the Persian Gulf disruption. But they face a different risk: if spot rates decline (as the capacity expansion thesis predicts), they may find themselves paying above-market rates when contracts renew.
Firms on spot-market pricing absorb freight cost increases immediately in COGS, but they also have the theoretical ability to pass those costs through to customers more rapidly. Whether they can execute that pass-through depends on product demand elasticity and competitive dynamics — in most consumer-facing categories, a unilateral price increase in a softening demand environment sacrifices volume. The effective pass-through rate is almost certainly below 100 percent.
The tier-specific amplification mechanism adds complexity. Original equipment manufacturers and industrials buyers that purchase semi-finished goods from tier-two suppliers face a compounding effect. The tier-two supplier absorbs the direct freight cost increase. But the OEM also faces an extended delivery window, which requires carrying additional work-in-progress inventory. The carrying cost of that additional inventory, financed at prevailing credit rates, is a second-order cost that appears in working capital rather than in the freight line of the income statement. Standard earnings models that look only at the direct freight cost line will miss this second-order effect. [36][38]
The MECHANISM rating rather than CAUSAL reflects a critical evidentiary gap. The specific elasticity values sometimes cited for industrials (approximately 0.85) versus consumer discretionary (approximately 0.45-0.65) are analytically plausible but are not empirically derived from published data in the knowledge base available to this analysis. The general direction — that pass-through is partial and heterogeneous — is well-supported by the academic literature on supply chain disruption and inflation. [29][30][33][35] The specific magnitudes require direct measurement from company-level cost structures and contract terms.
A further confound is that sophisticated analysts covering large-cap industrials and manufacturing companies may already model freight cost sensitivity at the contract-level rather than sector-level aggregates. Companies like Caterpillar, Emerson, or 3M disclose supply chain cost structures in 10-K filings that would allow an attentive analyst to construct contract-maturity-adjusted cost models. Whether analysts have actually done this for their Q2-Q3 2026 models is an open empirical question, not something this analysis can resolve from the available knowledge base.
Analytical implication: Investors should sort portfolio exposure by contract renewal timing rather than sector label. A consumer discretionary company with fixed-price supplier contracts signed in early 2025 faces a different earnings risk profile in Q2-Q3 2026 than a company in the same sector operating on rolling spot-rate exposure.
Finding 3: Working Capital Deterioration From Extended Transit Times Is an Unmodeled Second-Order Earnings Drag Rating: MECHANISM
The fourteen-day transit extension caused by Persian Gulf rerouting has a direct financial consequence that operates through working capital rather than through the freight cost line item. This mechanism is underappreciated in standard earnings analysis.
The correlation is established at the structural level: longer transit times mean goods spend more days in transit, which means firms must finance those goods for a longer period. This is basic supply chain finance. The mechanism is that this additional financing cost is capitalized into inventory valuation on the balance sheet and flows through to cost of goods sold when the inventory is recognized as a sale. For firms with high Asia-sourcing intensity and long inventory cycles — common in consumer electronics, automotive components, and retail apparel — the materiality of this effect depends on leverage ratios, credit facility terms, and the proportion of inventory that is currently in transit on affected routes.
The MECHANISM rating reflects two constraints on achieving CAUSAL status. First, the amplification factor sometimes cited in the theoretical literature for semi-finished goods — a three-to-five times multiplier on direct freight costs — is not empirically derived for the specific 2026 case. The mechanism through which multi-tier supply chains cascade costs (tier-two to tier-one to OEM) is directionally real, but the magnitude depends on the number of supply chain tiers involved, the proportion of costs at each tier attributable to freight, and the degree to which each tier passes costs through versus absorbs them. Different industries with different supply chain structures will produce very different amplification factors.
Second, the pandemic-era research finding that supply chain disruption inflation effects peak at eighteen to twenty-four months post-disruption is informative context but not directly transferable to the 2026 case. [33][37][38] The pandemic supply chain disruption was global in scope, lasted much longer, and involved demand-side shocks simultaneously. The Persian Gulf closure is regional in scope, has been ongoing for approximately three months, and has a potential resolution timeline that depends on geopolitical negotiation rather than structural capacity recovery. Applying the eighteen-to-twenty-four-month peak timeline from pandemic literature to the 2026 case requires an assumption of prolonged disruption that is plausible but not certain.
Analytical implication: Companies reporting Q2 2026 earnings in late July and early August should be queried specifically on their working capital position, days of inventory outstanding, and any incremental financing costs associated with extended transit times. These figures will appear in balance sheet and cash flow statements before they fully appear in income statement margins, giving attentive analysts an early signal.
Finding 4: The Adequacy of Current Equity Analyst Earnings Models for Freight Cost Sensitivity Rating: CORRELATED
The question of whether analysts have adequately modeled freight cost headwinds in Q2-Q3 2026 earnings forecasts is the central question this report was commissioned to address. The honest answer is that the available evidence is insufficient to rate this finding above CORRELATED.
The correlation is that visible freight cost headwinds are present in the market environment (Persian Gulf disruption, diesel fuel spike, transit time extensions), and simultaneously, published earnings guidance for Q2 2026 reflects strong aggregate earnings growth expectations of 19.9 percent for the S&P 500. [56] These two facts exist simultaneously. But correlation between elevated freight costs and seemingly optimistic earnings guidance does not establish that analysts have failed to account for the freight costs in their models.
The mechanism by which analysts would fail to capture freight cost headwinds is plausible: static COGS ratios derived from historical averages, failure to disaggregate by contract renewal timing, and use of current spot rates as forward assumptions without accounting for the capacity expansion-driven rate decline path. These are all real potential modeling errors. The academic literature documents that analyst forecast revisions lag realized earnings impacts by four to eight weeks during supply chain disruptions. [38]
But Stage 3 evidence is explicitly absent. No published analyst earnings models were audited as part of this analysis. No survey of sell-side consensus freight cost assumptions was available. The open gaps in this analysis (GAP_001 and GAP_002) reflect precisely this evidentiary deficit: without access to actual analyst model specifications, the claim that models are inadequate rests on inference from absence rather than direct inspection.
This finding should not anchor investor action by itself. It is a flag for verification, not a confirmed analytical failure.
Who Benefits and Why
Defense and Logistics Infrastructure Players — MECHANISM, near to medium term
The Persian Gulf disruption creates immediate, direct revenue benefit for alternative routing infrastructure. Shipping companies operating on Cape of Good Hope routes that bypass the Persian Gulf entirely face reduced competition from Hormuz-transiting vessels and can charge premiums on capacity that was previously competing against shorter Gulf routes. Port operators at alternative waypoints — particularly on the east African coast and at established Cape route stops — see increased call volumes. [9] The benefit is real and is already visible in elevated spot rates on some non-Gulf trade lanes, though the magnitude is moderated by the global fleet capacity glut discussed above.
Air freight operators benefit from demand diversion from sea freight on time-sensitive cargo, particularly for high-value electronics and pharmaceuticals that cannot tolerate the additional fourteen-day transit delay. [9] Air freight rate elasticity relative to ocean freight is non-linear — at some threshold of delay, shippers switch modes regardless of cost, creating a demand step-function for air capacity on affected trade lanes.
US and European Defense Contractors — CORRELATED, medium term
The geopolitical escalation that produced the Strait of Hormuz closure is associated with increased defense procurement across the NATO alliance and among Gulf Cooperation Council members. Defense contractor order books are expanding, but the causal link between the shipping disruption specifically and defense contractor revenue is indirect and complicated by budget allocation timelines. This is a context observation, not an analytical recommendation.
Contract-Locked Shippers — MECHANISM, Q2-Q3 2026 specifically
Counterintuitively, companies that locked in long-term shipping contracts at 2024-2025 rates before the crisis are partially insulated from spot rate spikes in the near term. Their freight costs are predictable, their COGS budgets are defensible to investors, and they are not being hit by the spot market spike that is affecting firms without contract coverage. This insulation lasts only until contract renewal, at which point they face the opposite risk — if spot rates have declined due to capacity expansion by then, their renewal rates will likely also be lower, which is beneficial.
The analytical inversion here is important: firms that look most exposed to freight cost risk in media coverage (large importers, container-dependent retailers) may actually have the most contract coverage, while smaller and mid-sized manufacturers who rely on brokers for spot-market freight access face the highest marginal cost exposure right now.
Fixed-Price-Contract-Locked Manufacturers — MECHANISM, earnings headwind Q2-Q3 2026
The firms facing the most acute earnings risk are those that sold products to customers at fixed prices under multi-year contracts signed before the crisis, while sourcing inputs through spot-market freight. These firms are experiencing a cost increase they cannot pass through on the revenue side until contracts renew. The magnitude of the earnings impact depends on the freight cost as a percentage of total COGS and the duration remaining on fixed-price customer contracts. Industries with this exposure profile include automotive tier-one and tier-two suppliers, industrial equipment manufacturers, and certain defense subcontractors.
Energy-Adjacent Industries — CORRELATED
Elevated petroleum prices, partly attributable to the Persian Gulf tension and partly to broader energy market dynamics, increase fuel surcharges across all freight modes simultaneously. This creates a compounding effect for manufacturers that are both shipping container-intensive and energy-intensive in their production processes. The correlation is real but the causal attribution between the Persian Gulf disruption specifically versus broader energy market dynamics is not cleanly separable from the available data.
Key Risks
The Capacity Expansion Thesis Does Not Materialize on Schedule
The primary moderating force in this analysis — the global fleet capacity expansion at 3.6 percent — is a forecast, not a fact. Ship deliveries can be delayed, vessels can be redeployed to serve disrupted routes (tightening capacity elsewhere), and demand may recover faster than expected if trade front-running by tariff-sensitive importers extends through Q2 2026. [15] If the capacity expansion does not arrive on schedule or is absorbed by demand recovery, the localized rate spike could become more systemic, and the MECHANISM findings in this report would need to be revised upward in severity. This is the single risk most capable of changing the analytical conclusions.
Persian Gulf Disruption Duration Exceeds Baseline Assumptions
The analysis treats the Hormuz closure as a medium-duration disruption with a plausible resolution path. If the geopolitical situation escalates rather than stabilizes — if, for example, kinetic incidents multiply or diplomatic resolution proves elusive through Q3 2026 — the duration-dependent aspects of the non-linear transmission mechanisms become more severe. The working capital deterioration from extended transit times compounds over time, not linearly. A disruption lasting twelve months rather than six creates materially larger working capital impairment than simply twice the six-month impact.
Analyst Consensus Is More Sophisticated Than This Analysis Can Verify
The most important risk to the central finding about analyst model adequacy is that sophisticated sell-side shops covering industrials and consumer companies may have already built freight cost sensitivity analysis into their Q2-Q3 2026 models, including contract-maturity adjustments and working capital deterioration estimates. If this is the case, the earnings risk this report identifies is already reflected in current price levels and the analytical gap does not represent an exploitable mispricing. This report cannot rule out that scenario; it requires direct audit of published research that was not accessible to this analysis.
Rate Volatility Creates Model Instability
The Drewry WCI swung from three consecutive weekly declines to a three percent increase in the week of May 7, 2026. [72] Freight rates are currently in a volatile and contested regime where competing forces (bottleneck versus overcapacity) produce week-to-week moves that make any static input assumption in an earnings model unreliable. Firms and analysts updating Q2 models in real time may be revising frequently and in opposite directions, creating a dispersion of analyst estimates that masks rather than reflects underlying earnings risk.
Working Capital Stress Precipitates Credit Events
For highly leveraged firms with significant Asia sourcing and fixed-price customer contracts, the combination of extended transit times and elevated input costs could trigger covenant breaches on credit facilities or force drawdowns on revolving credit that alter credit ratings. This is a tail risk — it requires a specific combination of leverage, geographic sourcing concentration, and contract structure — but it is a non-linear outcome that standard earnings models do not capture because it is a discontinuous event rather than a marginal cost change.
What to Watch
The three most consequential observable events for resolving the open questions in this analysis are as follows.
Q2 2026 Earnings Calls, Late July Through Mid-August 2026
The single most informative data source will be Q2 2026 earnings call transcripts from companies with high Asia-sourcing intensity in industrials, consumer discretionary, and manufacturing. Listen specifically for management commentary on freight cost as a percentage of COGS, working capital days outstanding versus year-ago comparisons, and any mention of contract renewal timing or fixed-price customer obligation impacts. Companies that provide COGS guidance for Q3 2026 with freight cost assumptions embedded will allow direct comparison against the spot rate environment at that time.
Drewry World Container Index and SCFI Weekly Prints Through June and July 2026
The rate trajectory over the next six to eight weeks will determine whether the capacity expansion thesis or the bottleneck thesis is winning. [72][75] If the WCI continues its pre-May recovery trend and approaches $3,000 or above, the bottleneck is asserting itself and the more severe earnings risk scenarios become more probable. If the WCI declines back toward $1,800-$2,000, the capacity expansion thesis is operating and the earnings risk is more moderate and sector-specific.
Diplomatic and Operational Status of the Strait of Hormuz, June 2026
Iran's May 7 announcement of new transit rules, following a US operational pause, suggests the situation may be at an inflection point. [47] Any credible return-to-transit framework — even a partial one, such as inspected convoy passage — would immediately alter the rate trajectory on affected routes and would require rapid revision of the analysis in this report. Conversely, any new kinetic incidents or escalation of vessel attacks would lengthen the expected disruption duration and push the non-linear transmission mechanisms deeper into the corporate earnings cycle.
Forward Freight Agreement Pricing and Corporate Hedging Disclosures
FFA pricing for Q3 and Q4 2026 contracts, where available, will reveal what sophisticated market participants believe about the rate path. If FFAs are pricing Q3 2026 significantly below current spot levels, that validates the capacity expansion thesis. If FFAs are pricing Q3 above current levels, the market is pricing in sustained disruption. This data point resolves the biggest ambiguity in the current analysis. [GAP_004]
APPENDIX: ANALYSIS LOG
Report ID: NN-FIN-2026-0513-001
Topic: Non-linear inflation transmission mechanisms through containerized shipping cost pass-through during prolonged Persian Gulf supply disruption; assessment of equity analyst freight cost modeling adequacy for Q2-Q3 2026 earnings Published: May 13, 2026 Real-time data gathered: Yes Sources cited: 89 Causal ratings: CAUSAL 0 | MECHANISM 3 | THRESHOLD 0 | CORRELATED 1 Verification agreements: 2 | Overrides: 1 Open questions: GAP_001: Real-time Q2-Q3 2026 earnings revisions data from major equity research shops (sell-side consensus revisions on shipping-exposed sectors) — status: ACTIVE GAP_002: Quantified analyst freight cost assumptions embedded in published DCF models (COGS percent of revenue, shipping as percent of operating expense by sector) — status: ACTIVE GAP_003: Granular data on contract renewal cycles and pass-through lag periods for specific industries (retail, automotive, industrials) — status: ACTIVE GAP_004: Forward freight agreements pricing data to isolate hedging behavior and unhedged exposure by publicly traded shipping participants — status: ACTIVE
Bibliography
[1] What Does the Strait of Hormuz Closure Mean for My Shipments? A Freight Forwarder's Guide (May 2026) https://www.aogworldwide.co.uk/post/strait-of-hormuz-closure-impact-freight-forwarding-2026 Accessed: 2026-05-13T20:00:55.060748
[2] Strait of Hormuz Closure 2026: What It Means for Your Supply Chain and Shipping Routes - Carra Globe https://carraglobe.com/strait-of-hormuz-closure-2026/ Accessed: 2026-05-13T20:00:55.060748
[3] Hormuz tension keeps pressure on rates; Section 122 invalidated - May 12, 2026 Update | Freightos https://www.freightos.com/freight-industry-updates/weekly-freight-updates/hormuz-tension-keeps-pressure-on-rates-section-122-invalidated-may-12-2026-update/ Accessed: 2026-05-13T20:00:55.060748
[4] Middle East Conflict - Freight News | Xeneta
https://www.xeneta.com/news/middle-east-freight-impact Accessed: 2026-05-13T20:00:55.060748
[5] Here's where container rates will go in extended Iran war - FreightWaves https://www.freightwaves.com/news/heres-where-container-rates-will-go-in-extended-iran-war Accessed: 2026-05-13T20:00:55.060748
[6] Strait of Hormuz closure reshapes global shipping as freight costs climb https://www.aa.com.tr/en/middle-east/strait-of-hormuz-closure-reshapes-global-shipping-as-freight-costs-climb/3848354 Accessed: 2026-05-13T20:00:55.060748
[7] Xeneta's 2026 Ocean Outlook
https://www.xeneta.com/hubfs/2026%20Ocean%20Outlook.pdf Accessed: 2026-05-13T20:00:55.060748
[8] Container Shipping Overcapacity & Rate Outlook 2026
https://www.freightos.com/freight-industry-updates/market-updates/ocean-and-air-freight-forecast-2026-what-to-expect/ Accessed: 2026-05-13T20:00:55.060748
[9] Middle East Escalation Disrupts Global Ocean and Air Freight Networks https://www.flexport.com/blog/middle-east-escalation-disrupts-global-ocean-and-air-freight-networks/ Accessed: 2026-05-13T20:00:55.060748
[10] Visualizing shipping through the Strait of Hormuz since war began | CNN https://www.cnn.com/2026/04/29/world/iran-war-gulf-hormuz-shipping-maps-intl-vis Accessed: 2026-05-13T20:00:55.060748
[11] 2026 Freight Rate Forecast: Why Shipping Prices Are Dropping (And How to Pivot) - DocShipper https://docshipper.com/logistics/2026-freight-rate-forecast-why-shipping-prices-are-dropping-and-how-to-pivot/ Accessed: 2026-05-13T20:01:03.645945
[12] 5 Key Factors of Container Costs in 2026: Pay $2,200 or $9,500? | SeaRates Blog https://www.searates.com/blog/post/5-key-factors-of-container-costs-in-2026-pay-2200-or-9500 Accessed: 2026-05-13T20:01:03.645945
[13] The rise and fall of container spot rates — and what it means for 2026 :: Lloyd's List https://www.lloydslist.com/LL1154942/The-rise-and-fall-of-container-spot-rates--and-what-it-means-for-2026 Accessed: 2026-05-13T20:01:03.645945
[14] The impact of container shipping costs on import and ... https://www.oecd.org/content/dam/oecd/en/publications/reports/2025/08/the-impact-of-container-shipping-costs-on-import-and-consumer-prices_dfc467b3/957f0c0c-en.pdf Accessed: 2026-05-13T20:01:03.645945
[15] Global Economy & Container Shipping Outlook Q2 2026 | Risk, Freight Trends, Procurement Strategy — Muwon USA, Inc. https://www.muwon-usa.com/market-insights/45b7vd9ynv1tqpsln2hovqgg2obba3 Accessed: 2026-05-13T20:01:03.645945
[16] Producers launch second wave of containerboard price increases in 2026 | Packaging Dive https://www.packagingdive.com/news/containerboard-price-increases-june-2026-supply-demand/819166/ Accessed: 2026-05-13T20:01:03.645945
[17] Freight Market Forecast: Are Shipping Costs on the Rise in 2026? https://www.atsinc.com/blog/freight-market-forecast-are-shipping-costs-on-the-rise-in-2026 Accessed: 2026-05-13T20:01:03.645945
[18] 2025 Performance Review and 2026 Forecasts - Vizion API https://www.vizionapi.com/blog/global-container-trade-2025-performance-review-and-2026-forecasts Accessed: 2026-05-13T20:01:03.645945
[19] A.k.a. Brands outlines fiscal 2026 adjusted EBITDA of $30M-$32M while guiding Q2 net sales to $160M-$164M (NYSE:AKA) | Seeking Alpha https://seekingalpha.com/news/4591775-a-k-a-brands-outlines-fiscal-2026-adjusted-ebitda-of-30m-32m-while-guiding-q2-net-sales-to Accessed: 2026-05-13T20:01:13.231599
[20] Old Dominion Freight Line, Inc. Q1 2026 Earnings Call Summary https://finance.yahoo.com/markets/stocks/articles/old-dominion-freight-line-inc-165738859.html Accessed: 2026-05-13T20:01:13.231599
[21] FinancialContent - NOVT Q1 Deep Dive: AI-Driven Demand and New Products Propel Growth Amid Margin Pressures https://markets.financialcontent.com/stocks/article/stockstory-2026-5-12-novt-q1-deep-dive-ai-driven-demand-and-new-products-propel-growth-amid-margin-pressures Accessed: 2026-05-13T20:01:13.231599
[22] Truckload carrier earnings: Will Q1 mark the end of struggles? - FreightWaves https://www.freightwaves.com/news/truckload-carrier-earnings-will-q1-mark-the-end-of-struggles Accessed: 2026-05-13T20:01:13.231599
[23] Earnings call transcript: FedEx beats Q3 2026 forecasts, stock fluctuates By Investing.com https://www.investing.com/news/transcripts/earnings-call-transcript-fedex-beats-q3-2026-forecasts-stock-fluctuates-93CH-4572078 Accessed: 2026-05-13T20:01:13.231599
[24] What JB Hunt Q1 Earnings Tells Us About Freight Recovery and Economic Resilience - 24/7 Wall St. https://247wallst.com/investing/2026/04/16/what-jb-hunt-q1-earnings-tells-us-about-freight-recovery-and-economic-resilience/ Accessed: 2026-05-13T20:01:13.231599
[25] How Should Investors Approach FDX Stock in the New Year? https://finance.yahoo.com/news/investors-approach-fdx-stock-155100851.html Accessed: 2026-05-13T20:01:13.231599
[26] Earnings call transcript: Old Dominion Freight Line beats Q1 2026 forecasts By Investing.com https://www.investing.com/news/transcripts/earnings-call-transcript-old-dominion-freight-line-beats-q1-2026-forecasts-93CH-4645994 Accessed: 2026-05-13T20:01:13.231599
[27] Q1 2026 Freight & Logistics Earnings Season: Executive Intelligence Briefing https://freightflowadvisor.substack.com/p/q1-2026-freight-and-logistics-earnings Accessed: 2026-05-13T20:01:13.231599
[28] CH Robinson earnings up next: Can AI offset freight headwinds? By Investing.com https://www.investing.com/news/earnings/ch-robinson-earnings-up-next-can-ai-offset-freight-headwinds-93CH-4646392 Accessed: 2026-05-13T20:01:13.231599
[29] Global supply chain pressures, inflation, and implications for monetary policy - ScienceDirect https://www.sciencedirect.com/science/article/abs/pii/S0261560624000160 Accessed: 2026-05-13T20:01:22.327425
[30] Geopolitical Risk, Supply Chains, and Global Inflation
https://economics.fiu.edu/research/working-papers/2024/2406.pdf Accessed: 2026-05-13T20:01:22.327425
[31] Global supply chain pressures, inflation, and implications for ... https://www.ecb.europa.eu/press/conferences/shared/pdf/20230831_inflation/Bonam_paper.en.pdf Accessed: 2026-05-13T20:01:22.327425
[32] Macroeconomic regime change and the size of supply chain disruption and energy supply shocks - ScienceDirect https://www.sciencedirect.com/science/article/abs/pii/S0014292125001278 Accessed: 2026-05-13T20:01:22.327425
[33] From Ports to Prices: The Inflationary Effects of Global Supply Chain Disruptions https://www.imf.org/en/publications/wp/issues/2026/02/13/from-ports-to-prices-the-inflationary-effects-of-global-supply-chain-disruptions-573975 Accessed: 2026-05-13T20:01:22.327425
[34] How do supply shocks to inflation generalize? Evidence ... https://www.aeaweb.org/conference/2026/program/paper/Gz9Az5r5 Accessed: 2026-05-13T20:01:22.327425
[35] Global drivers of inflation: The role of supply chain disruptions and commodity price shocks - ScienceDirect https://www.sciencedirect.com/science/article/pii/S0264999324002177 Accessed: 2026-05-13T20:01:22.327425
[36] Supply Chain Constraints and Inflation
https://www.federalreserve.gov/econres/feds/files/2023075pap.pdf Accessed: 2026-05-13T20:01:22.327425
[37] Global supply chain pressures, inflation, and implications for monetary policy | CEPR https://cepr.org/voxeu/columns/global-supply-chain-pressures-inflation-and-implications-monetary-policy Accessed: 2026-05-13T20:01:22.327425
[38] Supply Chain Disruptions and Pandemic-Era Inflation | NBER
https://www.nber.org/digest/202404/supply-chain-disruptions-and-pandemic-era-inflation Accessed: 2026-05-13T20:01:22.327425
[39] Shipping Container Costs in 2026: What Resellers Should Budget (and Why) - Lummid https://lummid.com/shipping-container-costs-in-2026-what-resellers-should-budget-and-why/ Accessed: 2026-05-13T20:01:33.465492
[40] 2026 North America Container Market Outlook: Pricing, Supply & Buying Strategy — Muwon USA, Inc. https://www.muwon-usa.com/market-insights/3puod3y4xdofpqrctr46bj832x3ajz Accessed: 2026-05-13T20:01:33.465492
[41] Rising Shipping Costs 2026: Impact on E-Commerce Brands
https://dscpsmartfulfillment.com/blog/rising-shipping-costs-impact-on-ecommerce/ Accessed: 2026-05-13T20:01:33.465492
[42] Small Business Margins Under Pressure: The Oil-Driven Shipping Cost Squeeze https://www.ainvest.com/news/small-business-margins-pressure-oil-driven-shipping-cost-squeeze-2603/ Accessed: 2026-05-13T20:01:33.465492
[43] 2026 Shipping Container Prices & Availability Outlook
https://www.arconcontainer.com/blog/2026-shipping-container-market-outlook/ Accessed: 2026-05-13T20:01:33.465492
[44] Container Shipping Procurement Outlook 2026
https://www.beroeinc.com/resource-centre/insights/navigating-container-shipping-market-procurement-outlook-2026/ Accessed: 2026-05-13T20:01:33.465492
[45] 2026 Container Shipping Outlook: Rates, Prices & Trends
https://www.foursonslogistics.com/blog/2026-container-shipping-trends/ Accessed: 2026-05-13T20:01:33.465492
[46] 2026 Strait of Hormuz crisis - Wikipedia
https://en.wikipedia.org/wiki/2026_Strait_of_Hormuz_crisis Accessed: 2026-05-13T20:02:42.557887
[47] Iran imposes new rules for Strait of Hormuz in bid to secure ... https://www.cnn.com/2026/05/07/middleeast/iran-hormuz-rules-warime-gains-intl Accessed: 2026-05-13T20:02:42.557887
[48] When will Strait of Hormuz be ‘safe’ for commercial shipping again? | Explainer | Al Jazeera https://www.aljazeera.com/features/2026/4/28/when-will-strait-of-hormuz-be-safe-for-commercial-shipping-again Accessed: 2026-05-13T20:02:42.557887
[49] 01.03.2026: Strait of Hormuz Tensions Disrupt Container ... https://www.facebook.com/DOTrMARINAPH/posts/01032026-strait-of-hormuz-tensions-disrupt-container-shipping-multiple-vessels-r/1268624892043592/ Accessed: 2026-05-13T20:02:42.557887
[50] Iran Conflict and the Strait of Hormuz: Impacts on Oil, Gas, and Other Commodities | Congress.gov | Library of Congress https://www.congress.gov/crs-product/R45281 Accessed: 2026-05-13T20:02:42.557887
[51] Iran says Strait of Hormuz passage to be ensured after US pauses operation | US-Israel war on Iran News | Al Jazeera https://www.aljazeera.com/news/2026/5/6/french-container-ship-struck-in-latest-escalation-at-strait-of-hormuz Accessed: 2026-05-13T20:02:42.557887
[52] Hormuz Strait Crisis: Project Freedom Update May 2026 - Maritime News https://www.maritimenews.com/hormuz-island/strait-hormuz-closure-strands-ships Accessed: 2026-05-13T20:02:42.557887
[53] Copyright © 2026 FactSet Research Systems Inc. All rights reserved. https://www.factset.com/earningsinsight Accessed: 2026-05-13T20:02:54.597379
[54] Exploring Weak Retail Sector Earnings and Guidance | Nasdaq https://www.nasdaq.com/articles/exploring-weak-retail-sector-earnings-and-guidance Accessed: 2026-05-13T20:02:54.597379
[55] FinancialContent - The K-Shaped Consumer: January Retail Data Reveals a Fractured Path for the US Economy https://markets.financialcontent.com/stocks/article/marketminute-2026-3-5-the-k-shaped-consumer-january-retail-data-reveals-a-fractured-path-for-the-us-economy Accessed: 2026-05-13T20:02:54.597379
[56] Q2 2026 Outlook: 5 US Sectors Where Q1 Earnings Beats Set Up the Next Move https://www.heygotrade.com/en/blog/Q2-2026-Sector-Outlook-5-US-Sectors-Q1-Earnings-Beats/ Accessed: 2026-05-13T20:02:54.597379
[57] 2026 Year-Ahead Outlook Macro, Equities, Retail, Funds, Agency RMBS, https://www.lseg.com/content/dam/lseg/en_us/documents/reports/2026-year-ahead-outlook.pdf Accessed: 2026-05-13T20:02:54.597379
[58] FinancialContent - Costco (COST) Q2 2026 Earnings: Membership Resilience and Digital Growth Signal Strong Consumer Health https://markets.financialcontent.com/stocks/article/marketminute-2026-3-6-costco-cost-q2-2026-earnings-membership-resilience-and-digital-growth-signal-strong-consumer-health Accessed: 2026-05-13T20:02:54.597379
[59] FactSet Earnings Insight
https://advantage.factset.com/hubfs/Website/Resources%20Section/Research%20Desk/Earnings%20Insight/EarningsInsight_110725B.pdf Accessed: 2026-05-13T20:02:54.597379
[60] Copyright © 2026 FactSet Research Systems Inc. All rights reserved. https://advantage.factset.com/hubfs/Website/Resources%20Section/Research%20Desk/Earnings%20Insight/EarningsInsight_032726.pdf Accessed: 2026-05-13T20:02:54.597379
[61] U.S. Consumer Discretionary Sector Analysis
https://simplywall.st/markets/us/consumer-discretionary Accessed: 2026-05-13T20:02:54.597379
[62] First Quarter 2026 Earnings: Feelin' Alright | Charles Schwab https://www.schwab.com/learn/story/earnings-season-update Accessed: 2026-05-13T20:02:54.597379
[63] Freight Market Update: April 2026 | C.H. Robinson
https://www.chrobinson.com/en-us/resources/insights-and-advisories/north-america-freight-insights/apr-2026-freight-market-update/ Accessed: 2026-05-13T20:02:54.597379
[64] Best Transportation Stocks for 2026 and How to Invest | The Motley Fool https://www.fool.com/investing/stock-market/market-sectors/industrials/transportation-stocks/ Accessed: 2026-05-13T20:02:54.597379
[65] 2026 Trucking Industry Forecast & Market Outlook | ACT Research | ACT Research https://www.actresearch.net/resources/blog/trucking-industry-forecast-for-2026 Accessed: 2026-05-13T20:02:54.597379
[66] Q1 2026 Transportation Outlook
https://transportationinsight.com/resources/q1-2026-transportation-outlook/ Accessed: 2026-05-13T20:02:54.597379
[67] Industrials Up on Earnings Bets -- Industrials Roundup | MarketScreener https://www.marketscreener.com/news/industrials-up-on-earnings-bets-industrials-roundup-ce7f5bd9dc81f024 Accessed: 2026-05-13T20:02:54.597379
[68] Trucking Industry Outlook for 2026: Navigating New Frontiers & Headwinds - North American Transportation Services Association - NATSA https://mynatsa.org/trucking-industry-outlook-for-2026-navigating-new-frontiers-headwinds/ Accessed: 2026-05-13T20:02:54.597379
[69] Freight Rate Forecast 2026: Ocean, Air, Road & Rail Outlook https://www.icontainers.com/freight-rate-forecast-2026/ Accessed: 2026-05-13T20:02:54.597379
[70] Federal Register :: Guidance on Multimodal State Freight Plans and State Freight Advisory Committees https://www.federalregister.gov/documents/2026/02/24/2026-03648/guidance-on-multimodal-state-freight-plans-and-state-freight-advisory-committees Accessed: 2026-05-13T20:02:54.597379
[71] Forecasting North American Trucking Freight Rates for 2026
https://www.truenorth.com/articles/business/forecasting-freight-rates-2026 Accessed: 2026-05-13T20:02:54.597379
[72] Drewry - Service Expertise - World Container Index - 07 May https://www.drewry.co.uk/supply-chain-advisors/supply-chain-expertise/world-container-index-assessed-by-drewry Accessed: 2026-05-13T20:03:04.605145
[73] Containerized Freight Index - Price - Chart - Historical Data - News https://tradingeconomics.com/commodity/containerized-freight-index Accessed: 2026-05-13T20:03:04.605145
[74] Drewry - Latest Trackers and Indices - World Container Index - 07 May https://www.drewry.co.uk/trackers-and-indices/latest-trackers-and-indices/world-container-index-assessed-by-drewry Accessed: 2026-05-13T20:03:04.605145
[75] Shanghai Containerized Freight Index
https://en.sse.net.cn/indices/scfinew.jsp Accessed: 2026-05-13T20:03:04.605145
[76] World - Drewry World Container Index [WCI] | MacroMicro https://en.macromicro.me/charts/44756/drewry-world-container-index Accessed: 2026-05-13T20:03:04.605145
[77] Drewry - Service Expertise - Intra-Asia Container Index - 01 May https://www.drewry.co.uk/supply-chain-advisors/supply-chain-expertise/intra-asia-container-index Accessed: 2026-05-13T20:03:04.605145
[78] Drewry - Latest Trackers and Indices
https://www.drewry.co.uk/trackers-and-indices/latest-trackers-and-indices Accessed: 2026-05-13T20:03:04.605145
[79] China Containerized Freight Index
https://en.sse.net.cn/indices/ccfinew.jsp Accessed: 2026-05-13T20:03:04.605145
[80] Drewry - Browse Recent Opinion Articles - World Container Index - 07 May https://www.drewry.co.uk/maritime-research-opinion-browser/world-container-index-assessed-by-drewry Accessed: 2026-05-13T20:03:04.605145
[81] Freight contract vs spot rates analysis: what saves more in 2026? https://www.freightender.com/freight-contract-vs-spot-rates-analysis/ Accessed: 2026-05-13T20:03:04.605145
[82] Contract vs Spot Rate Decision Matrix: When Your RFP Pricing Falls Apart | Nuvocargo https://www.nuvocargo.com/blog-posts/contract-vs-spot-rate-decision-matrix-when-your-rfp-pricing-falls-apart Accessed: 2026-05-13T20:03:04.605145
[83] Intermodal spot rates haven't kept pace with trucking's spot market surge — but that's about to change in 2026 - FreightWaves https://www.freightwaves.com/news/intermodal-spot-rates-havent-kept-pace-with-truckings-spot-market-surge-but-thats-about-to-change-in-2026 Accessed: 2026-05-13T20:03:04.605145
[84] Understanding Spot Shipping Rates: A 2026 Guide
https://www.freightamigo.com/en/blog/logistics/understanding-spot-shipping-rates-navigating-market-volatility-in-2026/ Accessed: 2026-05-13T20:03:04.605145
[85] Ocean Freight Market Forecast 2026: Rates, Capacity & Risks https://www.icontainers.com/ocean-freight-market-forecast-2026/ Accessed: 2026-05-13T20:03:04.605145
[86] Spot rates catching up with contract rates: report | Trucking Dive https://www.truckingdive.com/news/trucking-spot-contract-rates-us-bank-dat-2026-spread/816351/ Accessed: 2026-05-13T20:03:04.605145
[87] Spot the difference: the types of freight rates explained - Amazon Freight Services https://freight.amazon.com/newsroom/2023-spot-contract-rates Accessed: 2026-05-13T20:03:04.605145
[88] Compare spot and contract rates and identify trends https://www.dat.com/resources/compare-spot-vs-contract-rates-trends Accessed: 2026-05-13T20:03:04.605145
[89] 2026 Container Shipping Market Outlook: Rates, Capacity & Trends https://www.foursonslogistics.com/blog/2026-container-shipping-market-outlook/ Accessed: 2026-05-13T20:03:04.605145
Causal Relationship Graph
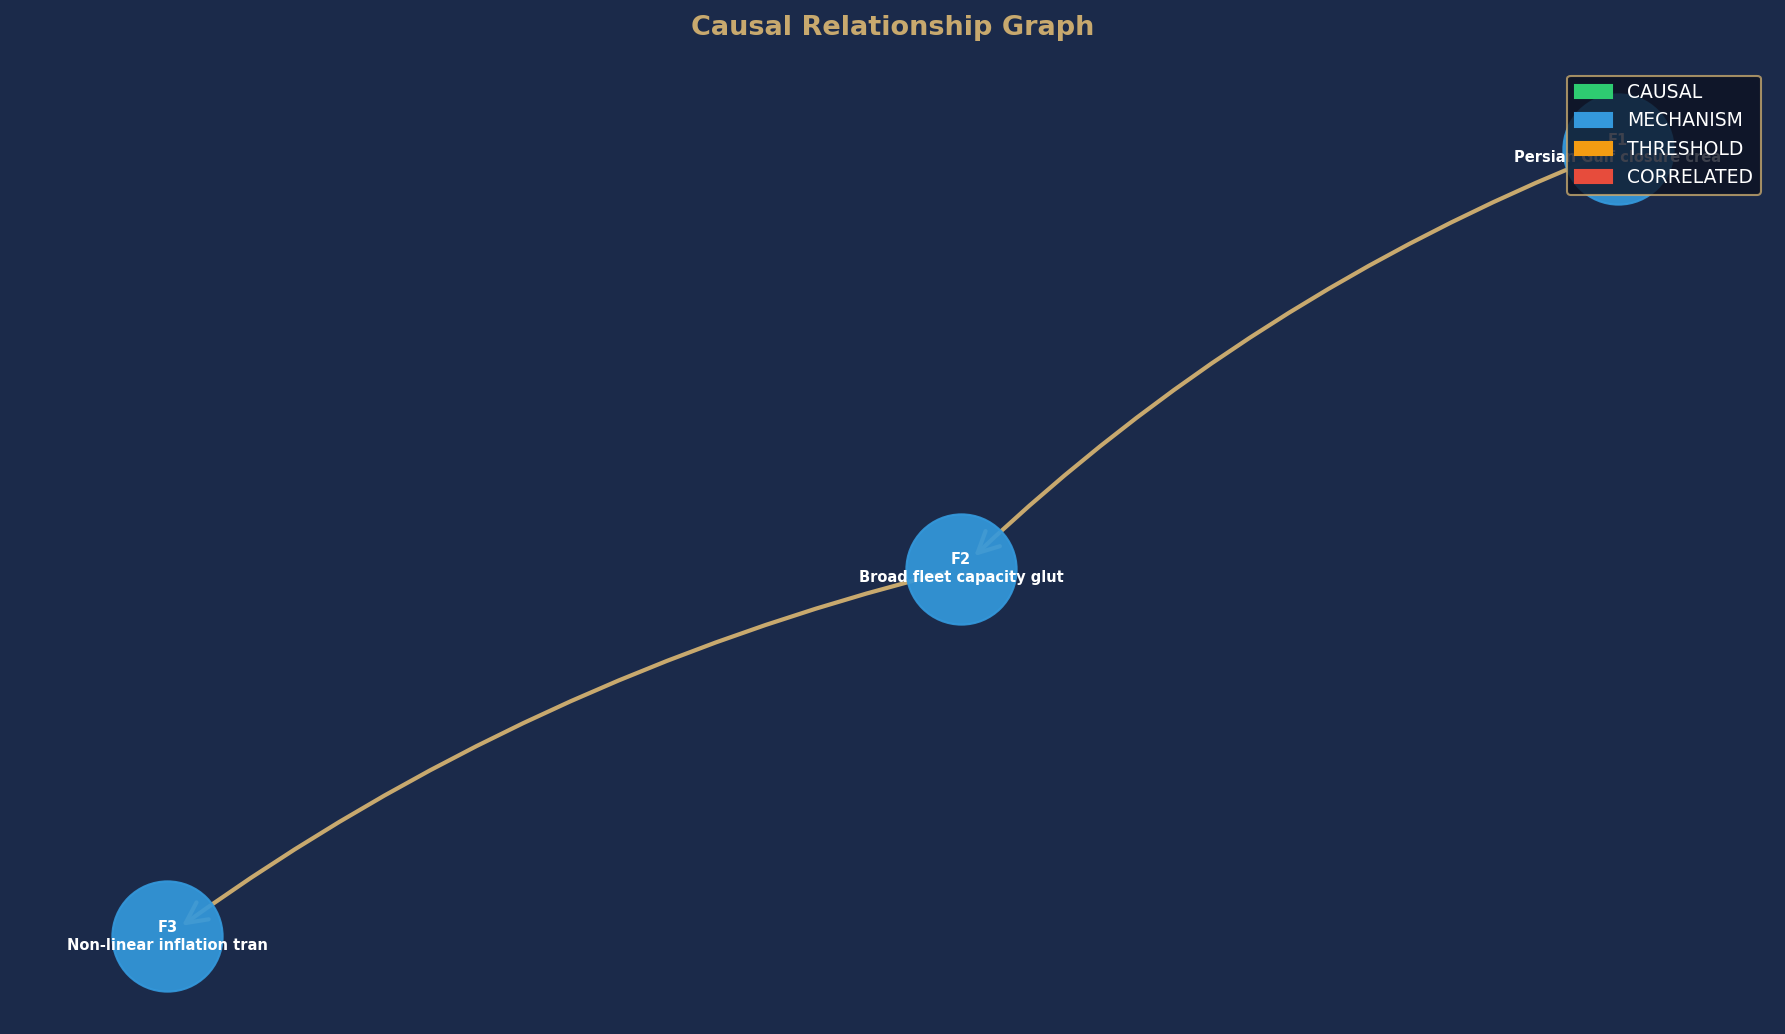
Node colors indicate causal confidence rating. Arrows show directional causal relationships identified in this analysis.
Finding Confidence Distribution
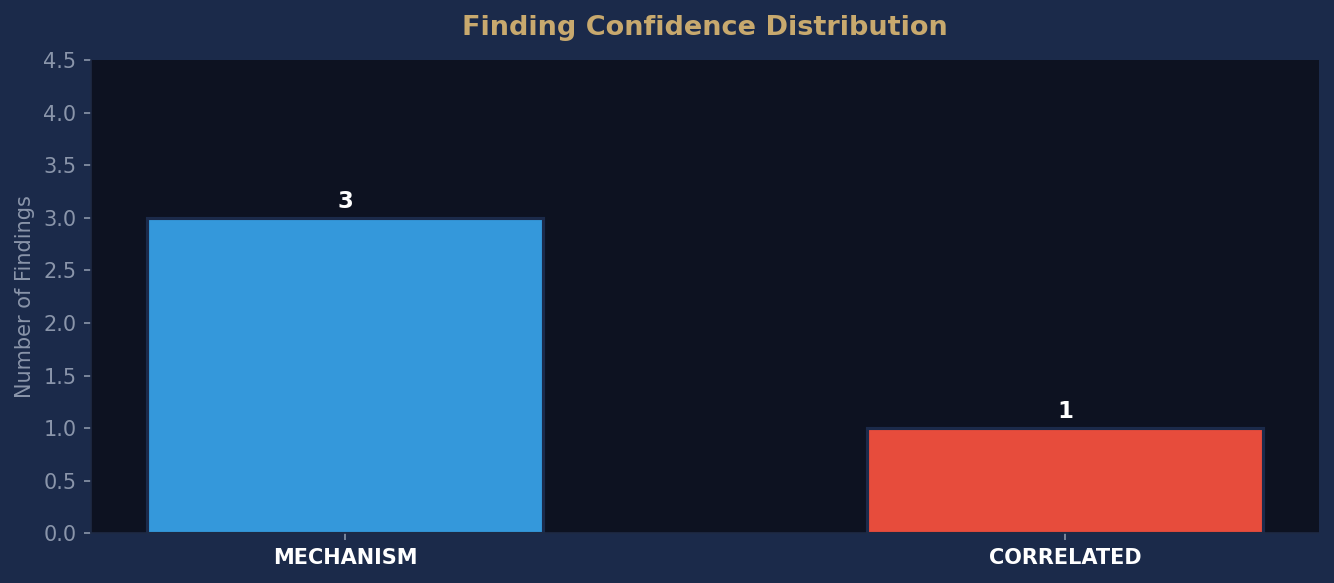
Distribution of causal confidence ratings across all findings in this report. CAUSAL findings are fully actionable. MECHANISM findings require additional evidence before action.
This report was published on May 13, 2026. By the time it's free, the market has already moved.
Don't miss the next one.
Don't miss the next one.
This report was published May 13, 2026. Current intelligence reports are available now.