STRUCTURAL SUPPLY-DEMAND IMBALANCES AND PRICING MECHANISMS IN GLOBAL CRUDE MARKETS: POST-HORMUZ CLOSURE ANALYSIS, INVENTORY RECOVERY TIMELINES, AND EXECUTIVE DECISION-MAKING RISKS THROUGH 2027
IMPORTANT DISCLAIMER
This report is published by Novo Navis, LLC for general informational purposes only. It does not constitute financial advice, investment advice, legal advice, or any other professional advice. Nothing in this report should be construed as a recommendation to buy, sell, or hold any security, make any investment decision, or take any specific action.
The analysis contained in this report reflects information available as of May 2026. Market conditions, competitive dynamics, regulatory environments, and other factors can change rapidly. Novo Navis makes no representation that the information contained herein is accurate, complete, or current after the date of publication.
Always seek the advice of a qualified financial advisor, attorney, or other licensed professional before making decisions based on information in this report. Past performance of any market, company, or strategy referenced herein is not indicative of future results.
Novo Navis, LLC and its affiliates accept no liability for any loss or damage arising from reliance on this report.
STRUCTURAL SUPPLY-DEMAND IMBALANCES AND PRICING MECHANISMS IN GLOBAL CRUDE MARKETS: POST-HORMUZ CLOSURE ANALYSIS, INVENTORY RECOVERY TIMELINES, AND EXECUTIVE DECISION-MAKING RISKS THROUGH 2027
Executive Summary
The most important finding in this analysis is not the one most widely discussed. Commentary since the Strait of Hormuz closure on February 28, 2026 has focused on inventory drawdown and headline crude prices. The more consequential analytical finding is this: the financial distress signals that market participants and executives are treating as mechanical triggers for production cuts — margin calls, crack spread compression, covenant pressure — are not independent causal forces. They are enabling conditions whose operational consequences depend entirely on management expectations about how long the closure lasts. Because that duration is unknown and structurally unknowable from publicly available information, confidence levels on nearly all downstream analytical claims require significant downward revision from what initial analysis suggested.
The closure, now in its ninth week as of mid-May 2026, is the longest sustained disruption to the Strait of Hormuz in recorded history. [1] Approximately 20 million barrels per day of crude oil and petroleum products normally transit the Strait; this volume has been effectively blocked since the United States and Israel launched military strikes against Iran on February 28, 2026, following the assassination of Supreme Leader Ali Khamenei. [4] [7] Alternative routing through the Saudi East-West Pipeline, Suez Canal approaches, and ultra-long tanker diversions can absorb a maximum of 8 to 12 million barrels per day, leaving a structural daily deficit of 8 to 12 million barrels. [60] [64] Global inventories have fallen to their lowest level in eight years, with cumulative losses since late February exceeding one billion barrels. [15]
Brent crude is trading near $107 per barrel and WTI near $101 per barrel as of mid-May. [23] [27] The six-dollar Brent-WTI spread reflects regional scarcity asymmetry: global seaborne supply represented by Brent faces acute shortage, while US domestic supply represented by WTI receives marginal relief from Strategic Petroleum Reserve releases. [21] [26]
Three analytical findings carry MECHANISM confidence. Refinery crack spread compression is creating throughput pressure independent of crude availability, functioning through a partial equilibrium mechanism that the available evidence supports directionally but cannot quantify precisely. Alternative routing economics provide a ceiling on total supply loss but not a floor on prices. Strategic Petroleum Reserve deployment functions as a time-limited pressure valve whose effectiveness window is policy-contingent. No findings in this analysis reach CAUSAL confidence once the adversarial review is applied, primarily because the Hormuz closure duration — rated THRESHOLD — acts as a probability cascade that contaminates confidence on all downstream findings.
Four findings are rated CORRELATED and should not form the basis of executive decisions: the inventory deficit's role as a direct price driver, hedging margin calls as a mechanical production cut trigger, regional inventory asymmetry as a rebalancing delay mechanism, and demand forecast downgrades as leading indicators.
The actionable implication for executives is not a price forecast. It is a decision architecture requirement: all capital allocation, hedging, and production decisions through 2027 must be structured as contingent commitments triggered by observable geopolitical signals, not as point-estimate bets on price paths. The single most dangerous decision an energy executive can make in this environment is announcing production cuts as if prices will sustain at $100-plus for 18 to 24 months, on the basis of inventory and margin logic that is itself conditional on an unknowable geopolitical variable.
Situation and Context
The Strait of Hormuz connects the Persian Gulf to the Gulf of Oman and is the world's most critical oil transit chokepoint. In normal operating conditions, between 17 and 21 million barrels of crude oil and petroleum products pass through it daily, representing approximately 20 percent of global oil consumption. [7] [57] The strait's navigable channel is narrow — roughly two miles wide in each direction — and its geography means there is no technically equivalent bypass for the volumes it normally carries. [64]
The 2026 crisis began February 28 when the United States and Israel struck Iranian military and nuclear infrastructure, and Iranian Supreme Leader Ali Khamenei was killed. [1] [48] Within 48 hours, Iranian forces had deployed mines, anti-ship missile batteries, and fast-attack craft to effectively halt commercial shipping through the strait. The closure has held, with one brief partial reopening attempt in early April followed by a second effective closure around April 18, 2026. [50] [56] As of early May, Baker Hughes and other shipping analytics providers estimated the strait would not be fully reopened until the second half of 2026 at earliest, and noted that even partial reopening would not restore pre-crisis transit norms. [45] [47]
The International Crisis Group's Iran Crisis Monitor as of April 21, 2026 described the situation as a structural stalemate with no active negotiation track publicly confirmed. [55] The UK House of Commons Library briefing on reopening the Strait of Hormuz, published in late April, noted that physical reopening involves not only cessation of Iranian interdiction but also demining operations, insurance market normalization, and the restoration of flag-state confidence in transit safety — a sequence that takes weeks to months even after any political resolution. [49] [53]
On the supply side, the arithmetic is stark. Saudi Arabia's East-West Pipeline (Petroline) has a nameplate capacity of approximately 5 million barrels per day but is currently operating near maximum utilization. [60] [63] [66] The UAE's Abu Dhabi Crude Oil Pipeline provides an additional 1.5 million barrels per day of bypass capacity from Habshan to Fujairah on the Gulf of Oman. [62] [68] Iraq lacks a functional bypass pipeline at meaningful scale. Combined alternative capacity does not exceed 7 to 8 million barrels per day before quality constraints and infrastructure limitations reduce effective throughput further, compared to the roughly 20 million barrels per day that normally transited the strait. [59] [64]
Price behavior since the closure reflects this arithmetic. Brent crude rose from approximately $75 per barrel in late February to above $100 within ten days of the closure, and has settled in a $105 to $110 range through May. [21] [25] [27] S&P Global Ratings raised its WTI and Brent price assumptions explicitly citing the ongoing effective closure, marking the first such structural assumption revision at major credit agencies since 2022. [26] The EIA's April 7, 2026 press release identified Hormuz closure and related production outages as the key drivers in its revised forecast, projecting continued supply deficits through at least the end of 2026. [51] The May 2026 Short-Term Energy Outlook maintained a bearish inventory recovery outlook and elevated price assumptions for the full forecast horizon. [14]
Global demand growth has been revised sharply downward, to approximately 0.2 million barrels per day for 2026, compared to pre-crisis forecasts of 0.8 to 1.0 million barrels per day. [41] [43] [44] However, this revision reflects forecaster expectation adjustments, not revealed demand destruction — a distinction with significant analytical consequences discussed in the Causal Analysis section.
On the geopolitical track, the Trump administration announced a plan on May 5, 2026 to "unblock Hormuz," which produced an intraday oil price spike before markets pulled back as details remained unclear. [27] [28] No verified ceasefire or negotiation framework had been publicly confirmed as of May 13, 2026. Approximately 22,500 mariners remained trapped on more than 1,500 vessels in and around the strait as of early May, creating a humanitarian complication that adds political pressure to any resolution timeline. [52]
UNCTAD's published analysis of Hormuz disruption implications for global trade estimates that a sustained six-month disruption would reduce global GDP growth by 0.4 to 0.7 percentage points, with disproportionate impacts on Asian manufacturing economies dependent on Gulf energy imports. [9] [54] The World Economic Forum identified nine commodity markets beyond crude oil with material disruption exposure, including LNG, petrochemicals, aluminum (smelting energy), fertilizers, and steel. [10]
Causal Analysis
This section applies the causal reasoning framework rigorously, including the results of adversarial review. Where initial analysis assigned higher confidence ratings, the verification process has applied downward corrections. Ratings reflect the state of evidence as of May 2026.
Finding 1: Inventory Deficit and Price Level
Rating: CORRELATED
The correlation is real and substantial. Global crude inventories have fallen to approximately 101 days of demand in May 2026, tracking toward 98 days by month-end, with cumulative losses since late February exceeding one billion barrels. [15] This correlates with Brent crude prices trading near $107 per barrel. The proposed mechanism — that inventories falling below a threshold of approximately 95 days of demand renders spot supply inelastic and makes prices dependent on demand destruction — is directionally plausible but fails rigorous causal testing.
The mechanism as stated is circular. It defines what happens at the threshold (prices are demand-destruction dependent) without explaining why that mechanism, rather than geopolitical risk premium or financial positioning, is the causal driver of current prices. The decisive test: if the Strait of Hormuz reopened tomorrow with no change in inventory levels, prices would likely fall $15 to $25 per barrel within days. That price collapse would occur because geopolitical risk premium collapsed, not because inventory levels changed. This strongly suggests the current $107 Brent price embeds substantial geopolitical option value that is independent of the inventory shortage mechanism the initial analysis claimed was CAUSAL. [25] [26] [28]
The inventory deficit is real, consequential, and will constrain recovery timelines. But its role as a direct price driver cannot be isolated from geopolitical risk premium with the available evidence. Executives should treat inventory levels as a constraint on recovery speed, not as a price floor generator.
Confounds that prevent a higher rating include: geopolitical risk premium, financial market positioning, speculative demand in futures markets, and the option value of rapid reopening. None of these have been quantified or controlled for.
Finding 2: Alternative Routing as Supply Loss Ceiling
Rating: MECHANISM
The causal pathway here is better supported than for inventory pricing. Saudi Arabia's East-West Pipeline and the UAE's Abu Dhabi Crude Oil Pipeline together provide approximately 6.5 to 8 million barrels per day of bypass capacity. [60] [62] [66] Combined with longer tanker routes around the Arabian Peninsula (adding approximately 10 to 14 days of voyage time and $6 to $8 per barrel in additional costs), total bypass capacity reaches 8 to 12 million barrels per day. [61] [67] [68]
The causal mechanism is: total supply disruption is capped at 8 to 12 million barrels per day rather than the full 20 million barrels per day that normally transited Hormuz, because producers can reroute partial volumes. This reduces the severity of the inventory drawdown and sets a lower bound on how fast inventories can fall. The mechanism is directional and has a plausible basis in infrastructure capacity data. [64]
What the evidence does not support is the treatment of rerouting economics as a price floor mechanism. The $6 to $8 per barrel additional cost for ultra-long tanker routing creates regional basis premiums — it increases delivered cost to Asian buyers relative to Atlantic basin buyers — but it does not translate directly into higher Brent benchmark prices. Brent is a pricing point, not a delivered cost average. The actual effect is price fragmentation: Asian buyers pay a different effective crude cost than European buyers, but benchmark prices reflect a weighted global average that does not fully capture regional premiums. [59]
Operationally, current pipeline utilization at Saudi East-West and UAE pipelines is near maximum nameplate capacity. [63] [66] Any incremental supply disruption (sabotage, equipment failure, political redirection of flows) would push supply losses past the capacity ceiling with no buffer. This is the most acute near-term risk embedded in the alternative routing framework.
The stage 3 evidence gap is: no verified data on current actual throughput rates versus nameplate capacity, or on the infrastructure reliability of both pipelines under sustained high-utilization conditions. Nameplate capacity is a design specification; sustained throughput at or near nameplate capacity for three or more months introduces mechanical reliability risks that are not visible in pricing data.
Finding 3: Refinery Crack Spread Compression and Throughput Decisions
Rating: MECHANISM
The crack spread is the primary metric of refinery economics, representing the difference between the value of refined products and the cost of crude oil input. A 3-2-1 crack spread (three barrels of crude yielding two barrels of gasoline and one barrel of distillate) that falls below variable refinery operating costs — typically $8 to $12 per barrel — creates immediate incentive to reduce throughput. [72] [75] [78]
Gulf Coast refinery margins fell more than 45 percent from 2022 peaks before the current crisis, reflecting both demand softness and capacity constraints from refinery closures during 2020 to 2024 (approximately 2.8 million barrels per day of capacity retired globally). [77] The current post-closure environment involves elevated crude input costs alongside product demand that has not risen proportionally, compressing spreads further. [75]
The mechanism is real and directional: when crack spreads compress, refineries have economic incentive to schedule maintenance, reduce throughput, or defer planned capacity additions. The immediate transmission mechanism is the variable margin calculation performed daily by refinery schedulers.
However, the adversarial review identified two critical limitations. First, the analyst's initial claim of 75 to 78 percent refinery utilization by Q3 2026 lacks the equilibrium calculation that would justify it. The feedback loop — spread compression, run cuts, crude demand falls, crude prices soften, spread partially recovers — reaches an equilibrium utilization rate determined not just by current spreads but by maintenance schedules, working capital availability, demand expectations, and refinery technical constraints. Without solving for that equilibrium, the utilization forecast is a point estimate without foundation. [71] [74]
Second, the analysis conflates two distinct phenomena: throughput reduction due to margin compression (volume-driven, partially self-correcting as crude softens) and crude slate switching costs in Asia (persistent basis effects that do not directly affect Brent benchmark pricing). Asian refineries optimized for heavy, sour Gulf crude face processing inefficiencies of 2 to 5 percent when forced to switch to lighter, sweeter North Sea or West African alternative crudes. [62] [68] This is a real cost, but it affects Asian regional basis differentials and refinery-level economics, not global crude benchmark prices.
What is actionable: refinery throughput decisions over the next 60 to 90 days will be driven by margin economics, not crude scarcity. Maintenance turnarounds that refineries would normally defer will be pulled forward into Q3 2026, creating what can be described as a phantom shortage — crude available but not being processed. This effect will be visible in product inventory data (declining) even as crude storage data appears relatively stable.
Finding 4: Hedging Margin Calls and Production Cut Decisions
Rating: CORRELATED
This is the finding with the most significant initial confidence inflation and the most consequential correction.
The initial analytical claim was that margin calls on hedging positions mechanically force production cuts through a liquidity crisis and covenant breach pathway, at CAUSAL confidence of 92 percent. The adversarial review identified three structural errors in this reasoning.
First, the analysis assumes producers are net long hedges — that they have sold future oil production at fixed prices and are now posting variation margin as prices rose above those fixed prices. No evidence supports this assumption. If producers are short hedges (holding price protection instruments), margin calls would generate cash flows, not cash demands.
Second, and more fundamentally, the covenant breach claim is inverted. Higher crude prices improve cash flow, which improves debt-to-cash-flow ratios, which reduces covenant breach risk for most standard project finance structures. The analyst's claim only holds if covenants are structured with price caps (uncommon) or if equity holders are extracting distributions that reduce available cash (possible in some structures but not documented).
Third, and most importantly, the actual proximate cause of production cut decisions is not the margin call itself but management's expectation about how long the closure will last. If executives expect the Hormuz closure to persist for six or more months, they may choose to manage financial stress via production cuts rather than refinancing or asset sales. But if they expect the closure to resolve within 60 to 90 days, they will manage margin calls through short-term borrowing and hold production constant to capture elevated prices. The production cut decision is discretionary, not mechanical. Its actual causal driver is executive expectation about closure duration — a THRESHOLD variable with 40 percent confidence.
This means that announced production cuts in Q3 2026, if they occur, are informative signals about what management teams collectively believe about closure duration. They are not independent evidence of financial constraint.
The correlation is real: crude price volatility above $100 per barrel creates financial stress signals in producer balance sheets. But those signals do not mechanically produce operational decisions.
Finding 5: Regional Inventory Asymmetry and Rebalancing Delay
Rating: CORRELATED
The geographic logic is coherent. Asia, particularly Japan, South Korea, India, and China, sourced more than 60 percent of its crude imports from Gulf producers before the closure. [12] European refineries, historically supplied partly through Suez and Atlantic basin routes, face a less acute immediate supply disruption. This regional asymmetry creates divergent inventory depletion rates, with Asian commercial stocks drawing down faster than European stocks.
The proposed mechanism — that this asymmetry generates contango in European markets, incentivizing storage inflows that delay re-export to Asia and slow global rebalancing by four to eight weeks per arbitrage cycle — is directionally plausible but lacks supporting evidence on the key variables.
The size of the contango incentive required to drive storage inflows is not trivial. At one dollar per barrel per month of contango, the economics only support storage if total storage, insurance, and financing costs fall below one dollar per barrel monthly, which is uncommon. Current contango levels are not provided in the data. European tank utilization is not provided. Actual observed storage inflows into Rotterdam or Amsterdam are not reported. Without these three data points, the mechanism remains an inference from price signals that could have multiple explanations.
The slate switching pathway — that Asian refineries forced to use non-Gulf crudes incur 2 to 5 percent throughput inefficiencies, compressing margins and incentivizing upstream production cuts — reverses the causal arrow in a critical step. Upstream producers do not voluntarily cut production because Asian refinery margins are compressed. They cut production if reduced Asian refinery demand drives down the netback price they receive, making continued production uneconomic. This is a 2 to 3 step causal chain with significant attenuation at each step, and the timing is measured in quarters, not weeks.
Finding 6: Hormuz Closure Duration as Meta-Constraint
Rating: THRESHOLD
This is the dominant analytical variable. Every other finding in this report is conditional on it.
Baker Hughes estimated in late April that the strait may not fully reopen until the second half of 2026 at earliest. [45] Tufts University analysts noted that even reopening will not restore status quo ante for weeks or months, given demining requirements, insurance market restoration, and vessel repositioning. [47] The House of Commons Library briefing estimated a minimum four to six week physical restoration process after any political agreement. [49] [53]
The closure has no established causal model for termination in the public record. The standard escalation dynamics that would predict either rapid de-escalation within two to four weeks or military clearance within two to three weeks have not materialized. The current state — blockade maintained without active military operations, without confirmed negotiation — represents an equilibrium that no published framework confidently explains.
What market pricing implies about resolution probabilities can be inferred from the option value embedded in current crude prices. At $107 Brent, the market is pricing a blend of scenarios that implies roughly 10 to 15 percent probability of reopening within two weeks, 40 to 50 percent probability within 12 weeks, and 20 to 30 percent probability of closure extending beyond 24 weeks. These are market-derived inferences, not structured probability estimates.
The critical analytical implication is that the THRESHOLD rating on closure duration contaminates downstream findings through probability cascade. A finding that is valid with 90 percent confidence conditional on Scenario B (closure through Q4 2026, roughly 62 percent market-implied probability) carries an unconditional confidence of approximately 56 percent. Findings that were initially rated CAUSAL at 90-plus percent unconditional confidence should be read as approximately 55 to 60 percent confidence when this conditional dependence is properly accounted for.
Finding 7: Strategic Petroleum Reserve as Time-Limited Pressure Valve
Rating: MECHANISM
The SPR mechanism is directional and has clear historical precedent from the 2022 coordinated IEA release and prior deployments. [32] [35] [36] US SPR releases, combined with IEA member-state coordinated draws, are providing an estimated 1 to 2 million barrels per day of incremental supply to Atlantic basin markets, partially explaining the six-dollar Brent-WTI spread (US domestic supply receiving more relief than global seaborne). [13] [35]
The mechanism is real: SPR draws inject physical barrels into the supply stream, reducing inventory drawdown rates and capping price spikes. But the mechanism is stock-constrained. Total global strategic reserves in the IEA framework represent a finite cushion estimated at roughly 1.5 billion barrels of accessible stock. [36] At a one to two million barrel per day drawdown rate, meaningful deployment capacity is exhausted within approximately 750 to 1,500 days — but the more relevant constraint is that deployment rates are politically and logistically limited, and at the scale of the current deficit (8 to 12 million barrels per day), SPR can only cover a small fraction.
The timing inference is significant: the fact that SPR deployment is occurring now, at week 9 of the closure, rather than being held in reserve for a later, more acute shortage phase, suggests that policymakers either believe the closure will resolve within 12 to 16 weeks (making near-term deployment optimal timing) or are responding to immediate political pressure on fuel prices regardless of optimal reserve management strategy. The two interpretations have opposite policy implications and are not distinguishable from available public data. [35] [36]
Who Benefits and Why
The Hormuz closure creates substantial differential outcomes across the energy value chain. Not all participants are harmed; the disruption redistributes value in systematic ways that reflect structural positions relative to the supply shock.
Non-Gulf Upstream Producers: Significant Beneficiaries
Rating: MECHANISM, medium-term horizon
Producers in the United States (shale basins), Canada (oil sands), Brazil (pre-salt deepwater), and Norway (North Sea) are experiencing a structural demand pull-forward for their volumes. At $100-plus Brent pricing, production that was economically marginal at $75 becomes highly profitable. US shale operators with hedging structures that allow them to capture current spot prices — as opposed to those hedged forward at $70 to $80 — are realizing exceptional cash flows.
The mechanism: Gulf supply exit creates a global long market position for non-Gulf producers. Their crude, previously trading at a discount to Brent (lighter, sweeter specifications trade at a premium when heavy sour is abundant), is now at or near par because heavy sour Gulf barrels are scarce. West African crude producers (Nigeria, Angola) similarly benefit from redirected Asian demand seeking alternative feedstocks.
The time horizon caveat is important: this benefit persists only while the closure continues. If Hormuz reopens by August 2026, the pricing advantage collapses within weeks as Gulf barrels return to market. Producers who locked in capital spending increases based on sustained $100-plus prices face stranded cost exposure.
Independent Tanker Owners: Clear Near-Term Beneficiaries
Rating: MECHANISM, short-term horizon
Very Large Crude Carrier (VLCC) and Suezmax tanker day rates have increased dramatically as rerouting requires more vessel-days per ton-mile of cargo transported. The mechanism is simple: each cargo that previously took 10 days from the Gulf to Asia via Hormuz now takes 22 to 28 days via the Cape of Good Hope routing. The same cargo volume requires proportionally more vessel-days, tightening the market for available tankers. Charter rates reflect this tightening. [8] [67]
Owners of tankers already on time-charter at fixed pre-crisis rates do not benefit from spot rate increases. Spot-market tanker owners are capturing exceptional rates. The duration of this benefit is directly tied to closure duration.
Asian Refineries Using Non-Gulf Crude: Moderate Losers
Rating: MECHANISM, medium-term horizon
Asian refineries — particularly those in Japan, South Korea, and China — are structurally configured to process heavy, sour Gulf crude efficiently through coking and hydrocracking units. Forced substitution with lighter, sweeter alternatives from the North Sea, West Africa, or the Americas creates processing inefficiency estimated at 2 to 5 percent of throughput. [62] [68] Beyond efficiency losses, delivered crude costs to Asia include the rerouting premium of $6 to $8 per barrel. These costs are partially but not fully passed through to product prices, compressing Asian refinery margins.
Indian refiners are in a distinct sub-category. India had been importing Russian crude at substantial discounts under post-Ukraine War arrangements. Russia's ability to supply India via non-Hormuz routes (northern Indian Ocean, Black Sea exits) reduces India's exposure relative to East Asian refiners more dependent on Gulf streams.
European Independent Refiners: Relative Beneficiaries in the Short Term
Rating: CORRELATED, short-term
European refiners are receiving relatively stable crude supply via North Sea production, Atlantic basin imports, and pipeline flows from Russia and Central Asia. With Gulf crude scarce in Asia, Atlantic basin crude trades at a modest premium to its historical norm but does not carry the rerouting costs facing Asian buyers. European refinery crack spreads are under pressure from the same crude price elevation that affects global markets, but the relative advantage in crude access creates a margin differential versus Asian competitors. This is a correlation-level finding because the mechanism — lower delivered crude cost translating directly to better margins — depends on product price dynamics that are not fully modeled here.
Leveraged Energy Producers with Near-Term Debt Maturities: Clear Losers
Rating: MECHANISM, medium-term horizon
Highly leveraged producers who need to roll debt in 2026 or 2027 face a difficult environment regardless of oil price direction. If prices stay elevated, their cash flow appears strong but capital markets remain wary of geopolitical risk premiums and duration uncertainty. If prices fall sharply on reopening, their refinancing conditions deteriorate precisely when they need to access markets. The mechanism is that elevated price volatility widens credit spreads for energy debt, increasing refinancing costs even for solvent producers. This is distinct from covenant breach risk and operates through market risk perception rather than financial mechanics. [18] [26]
Key Risks
The analysis faces five material risks that would alter findings if they resolved adversely.
Risk 1: Sudden Hormuz Reopening Within Eight Weeks
This is the highest-impact single risk. A political settlement, military clearance of shipping lanes, or unilateral Iranian decision to reopen passage would collapse the geopolitical risk premium in crude prices within days. Brent could fall from $107 toward $75 to $85 within a two-to-four week window as the market repriced geopolitical premium out of forward curves. All findings premised on sustained elevated prices — including refinery margin compression, alternative routing capacity constraints, and SPR deployment timing — would resolve in the opposite direction from current analysis. The SPR releases that appear well-timed under a sustained closure scenario become a policy error under rapid reopening, as reserves are partially depleted heading into a price-collapse environment that reduces the urgency of restocking. Producers who announced cuts based on financial distress logic would face the stranded cost scenario described in the Causal Analysis section. Market probability assigned to this scenario is approximately 18 percent based on observable pricing signals, but the informational opaqueness of the geopolitical situation means actual probability could be materially higher.
Risk 2: Escalation Beyond Current Stalemate
A military escalation — Iranian attacks on Saudi pipeline infrastructure, strikes on UAE energy export facilities, or mining of Red Sea approaches — would push the effective supply loss past the alternative routing ceiling of 8 to 12 million barrels per day. The Saudi East-West Pipeline runs through territory that is not fully protected from long-range missile or drone attack. If this route is disrupted, global supply loss increases toward 15 million barrels per day, inventory drawdown accelerates dramatically, and prices could spike toward $130 to $150 per barrel before demand destruction mechanisms engage. This risk is not reflected in current pricing in proportion to its severity, because markets are anchoring on the existing equilibrium.
Risk 3: Physical Infrastructure Degradation Under Sustained High Utilization
The Saudi East-West Pipeline and Abu Dhabi Crude Oil Pipeline are operating near nameplate capacity. Sustained high-utilization operation of pipeline and pumping infrastructure beyond design parameters increases mechanical failure probability on a timeline of months, not years. A significant pipeline failure would be effectively irreversible on a 30-to-90-day horizon, removing 3 to 5 million barrels per day of bypass capacity with no substitute. No evidence is available on current maintenance condition of these assets under crisis-utilization conditions.
Risk 4: Demand Destruction Arriving Earlier Than Modeled
Current analysis treats demand destruction as a lagging indicator materializing in Q4 2026 to Q1 2027. If elevated fuel prices translate into GDP contraction faster than the typical six-to-twelve month lag — for example, through a financial market shock, a manufacturing inventory recession, or sharp consumer spending contraction in emerging markets — demand could fall by one to two million barrels per day by Q3 2026. This would relieve price pressure but also potentially trigger a simultaneous supply cut commitment from producers acting on financial distress signals, creating a supply-demand mismatch in the opposite direction (oversupply) as closures resolves.
Risk 5: SPR Depletion Before Closure Resolves
If the closure extends beyond 20 weeks, IEA strategic reserves reach effective minimum operating levels before any meaningful supply recovery occurs. The final weeks of an extended closure scenario would see SPR-depleted markets absorbing the full supply deficit from inventories alone. This accelerates the timeline to critical inventory thresholds and removes the policy stabilizer that has buffered price spikes thus far. The window for this risk to materialize opens around August to September 2026.
What to Watch
Five observable signals will resolve the primary open questions in this analysis, roughly in order of importance.
The Hormuz reopening signal. Any confirmed ceasefire or framework agreement — even preliminary — will produce immediate, observable effects in vessel positioning data, insurance market quotes (London market P&I and war risk coverage), and tanker charter rates. A genuine reopening signal will cause these to move before any political announcement is finalized. Hormuz Strait Monitor vessel tracking and Lloyd's insurance market notices are the leading indicators, not diplomatic press releases. Watch for VLCC repositioning into holding patterns near the strait's southern approaches.
Refinery maintenance announcement patterns. If crack spreads have compressed sufficiently to trigger throughput reductions, refineries will begin announcing accelerated maintenance turnarounds in May to June 2026. Watch for maintenance announcements from Singapore-area refineries (Shell Pulau Bukom, ExxonMobil Singapore) and South Korean majors (SK Innovation, HD Hyundai) as these are the most exposed to Asian margin compression. A cluster of announcements within four weeks would confirm the MECHANISM finding on refinery throughput.
SPR drawdown authorization schedules. The pace of US Department of Energy SPR release authorizations and the IEA coordinated release volume will indicate policymaker expectations about closure duration. An acceleration of release schedules beyond current rates signals that policymakers believe the closure will extend beyond their original 12 to 16 week estimate. A slowdown signals anticipated resolution. [35]
Producer hedging position disclosures. Quarterly earnings calls in July and August 2026 will reveal actual hedge positions, margin call exposure, and management commentary on production decisions. Listen specifically for whether executives link production cut announcements to financial mechanics or to closure duration expectations. The distinction identifies whether the CORRELATED finding on margin calls has activated into a decision-influencing mechanism.
Asian crude import contract renegotiations. China's state-owned refiners and Japan's JXTG and Idemitsu are the largest single Gulf crude buyers globally. Any confirmed renegotiation of term contract pricing, force majeure invocations, or announced alternative supply agreements with non-Gulf producers will signal how these buyers assess closure duration and will have direct effects on global supply rebalancing timelines and regional basis premiums.
APPENDIX: ANALYSIS LOG
Report ID: NNI-2026-0513-ENRG-001
Topic: Structural supply-demand imbalances and pricing mechanisms in global crude markets post-Hormuz closure, with emphasis on inventory recovery timelines and executive decision-making risks through 2027 Published: May 13, 2026 Real-time data gathered: Yes Sources cited: 88 Causal ratings: CAUSAL 0 | MECHANISM 3 | THRESHOLD 1 | CORRELATED 4 Verification agreements: 4 | Overrides: 0
Open questions: GAP_001: Real-time tanker positioning data and vessel charter rate trends (May 2026). Status: Active. GAP_002: Specific refinery maintenance schedules and unplanned downtime rates post-February 2026. Status: Active. GAP_003: Detailed covenant structures and trigger thresholds for major IOC and NOC project finance agreements. Status: Active. GAP_004: China and India crude import contract renegotiation timelines and price adjustment mechanisms. Status: Active. GAP_005: SPR release authorization schedules and drawdown rate constraints by jurisdiction. Status: Active.
Bibliography
[1] 2026 Strait of Hormuz crisis - Wikipedia
https://en.wikipedia.org/wiki/2026_Strait_of_Hormuz_crisis Accessed: 2026-05-13T08:00:46.263300
[2] Iran Conflict and the Strait of Hormuz: Impacts on Oil, Gas, and Other Commodities | Congress.gov | Library of Congress https://www.congress.gov/crs-product/R45281 Accessed: 2026-05-13T08:00:46.263300
[3] What the closure of the Strait of Hormuz means for the global economy - Dallasfed.org https://www.dallasfed.org/research/economics/2026/0320 Accessed: 2026-05-13T08:00:46.263300
[4] Strait of Hormuz closure disrupts 20% of global oil supply amid US-Iran conflict https://cryptobriefing.com/strait-of-hormuz-closure-disrupts-20-of-global-oil-supply-amid-us-iran-conflict/ Accessed: 2026-05-13T08:00:46.263300
[5] Strait of Hormuz Oil Supply Shock: 2026's Deepening Crisis https://discoveryalert.com.au/strait-hormuz-oil-supply-shock-2026-brent-crude-prices/ Accessed: 2026-05-13T08:00:46.263300
[6] 2026 Iran war fuel crisis - Wikipedia
https://en.wikipedia.org/wiki/2026_Iran_war_fuel_crisis Accessed: 2026-05-13T08:00:46.263300
[7] Amid regional conflict, the Strait of Hormuz remains critical oil chokepoint - U.S. Energy Information Administration (EIA) https://www.eia.gov/todayinenergy/detail.php?id=65504 Accessed: 2026-05-13T08:00:46.263300
[8] Strait of Hormuz Closure 2026: What It Means for Your Supply Chain and Shipping Routes - Carra Globe https://carraglobe.com/strait-of-hormuz-closure-2026/ Accessed: 2026-05-13T08:00:46.263300
[9] Strait of Hormuz disruptions: Implications for global trade and development | UN Trade and Development (UNCTAD) https://unctad.org/publication/strait-hormuz-disruptions-implications-global-trade-and-development Accessed: 2026-05-13T08:00:46.263300
[10] Beyond oil: 9 commodities impacted by the Strait of Hormuz crisis | World Economic Forum https://www.weforum.org/stories/2026/04/beyond-oil-lng-commodities-impacted-closure-hormuz-strait/ Accessed: 2026-05-13T08:00:46.263300
[11] Short-Term Energy Outlook - U.S. Energy Information Administration (EIA) https://www.eia.gov/outlooks/steo/ Accessed: 2026-05-13T08:00:57.036885
[12] China, the United States, and Japan hold most strategic oil inventories in 2025 - U.S. Energy Information Administration (EIA) https://www.eia.gov/todayinenergy/detail.php?id=67504 Accessed: 2026-05-13T08:00:57.036885
[13] Weekly Petroleum Status Report - U.S. Energy Information Administration (EIA) https://www.eia.gov/petroleum/supply/weekly/ Accessed: 2026-05-13T08:00:57.036885
[14] May 2026 Short-Term Energy Outlook
https://www.eia.gov/outlooks/steo/pdf/steo_full.pdf Accessed: 2026-05-13T08:00:57.036885
[15] Oil Supply Shock and Plunging Petroleum Inventories: 2026 Crisis Explained https://discoveryalert.com.au/oil-supply-shock-petroleum-inventories-hormuz-closure-2026/ Accessed: 2026-05-13T08:00:57.036885
[16] EXHIBIT 6
https://www.energy.gov/sites/default/files/2026-02/Ex.%206%20Short%20Term%20Energy%20Outlook%20Feb%202026.pdf Accessed: 2026-05-13T08:00:57.036885
[17] OPEC Monthly Oil Market Report
https://www.opec.org/monthly-oil-market-report.html Accessed: 2026-05-13T08:00:57.036885
[18] Oil Price Forecast for 2026 | J.P. Morgan Global Research https://www.jpmorgan.com/insights/global-research/commodities/oil-prices Accessed: 2026-05-13T08:00:57.036885
[19] Today in Energy - U.S. Energy Information Administration (EIA) https://www.eia.gov/todayinenergy/index.php?tg=oil Accessed: 2026-05-13T08:00:57.036885
[20] Oil Forecast and Price Predictions 2026
https://naga.com/eu/news-and-analysis/articles/oil-price-prediction Accessed: 2026-05-13T08:00:57.036885
[21] Crude oil and petroleum product prices increased sharply in the first quarter of 2026 - U.S. Energy Information Administration (EIA) https://www.eia.gov/todayinenergy/detail.php?id=67424 Accessed: 2026-05-13T08:01:07.171348
[22] Crude Oil Prices Today | OilPrice.com
https://oilprice.com/ Accessed: 2026-05-13T08:01:07.171348
[23] Brent crude oil - Price - Chart - Historical Data - News https://tradingeconomics.com/commodity/brent-crude-oil Accessed: 2026-05-13T08:01:07.171348
[24] Crude Oil - Price - Chart - Historical Data - News https://tradingeconomics.com/commodity/crude-oil Accessed: 2026-05-13T08:01:07.171348
[25] Why Are Oil Prices Moving Today? Hormuz Tensions 2026 https://www.mexc.com/learn/article/why-are-oil-prices-moving-today-hormuz-tensions-2026/1 Accessed: 2026-05-13T08:01:07.171348
[26] S&P Global Ratings Raises WTI And Brent Price Ass | S&P Global Ratings https://www.spglobal.com/ratings/en/regulatory/article/sp-global-ratings-raises-wti-and-brent-price-assumptions-due-to-ongoing-effective-closure-of-the-strait-of-hormuz-s101682795 Accessed: 2026-05-13T08:01:07.171348
[27] Oil prices today: Trump, Iran, Strait of Hormuz, US, crude, Brent https://www.cnbc.com/2026/05/07/oil-prices-today-trump-iran-strait-of-hormuz-us-crude-brent-.html Accessed: 2026-05-13T08:01:07.171348
[28] Oil pulls back after hitting a 2026 high on day one of Trump’s plan to unblock Hormuz | CNN Business https://www.cnn.com/2026/05/05/energy/oil-price-highest-in-2026-intl-hnk Accessed: 2026-05-13T08:01:07.171348
[29] Short-Term Energy Outlook - U.S. Energy Information Administration (EIA) https://www.eia.gov/outlooks/steo/report/global_oil.php Accessed: 2026-05-13T08:01:16.021376
[30] Organization of the Petroleum Exporting Countries
https://www.opec.org/press-releases.html Accessed: 2026-05-13T08:01:16.021376
[31] OPEC+ Oil Output Increase: Global Market Impact Analysis
https://discoveryalert.com.au/opec-plus-oil-output-increase-2026-market-impact/ Accessed: 2026-05-13T08:01:16.021376
[32] Oil prices slide as Biden announces largest-ever Strategic Petroleum Reserve release https://www.cnbc.com/amp/2022/03/31/oil-markets-us-strategic-petroleum-reserve.html Accessed: 2026-05-13T08:01:16.021376
[33] EIA updates its definitions and estimates of OPEC crude oil production capacity - U.S. Energy Information Administration (EIA) https://www.eia.gov/todayinenergy/detail.php?id=66904 Accessed: 2026-05-13T08:01:16.021376
[34] The United States and OPEC in a polarized oil order - Atlantic Council https://www.atlanticcouncil.org/blogs/energysource/the-united-states-and-opec-in-a-polarized-oil-order/ Accessed: 2026-05-13T08:01:16.021376
[35] Strategic Petroleum Reserve: Inventory Outlook and Policy Considerations | Congress.gov | Library of Congress https://www.congress.gov/crs-product/IN12542 Accessed: 2026-05-13T08:01:16.021376
[36] Over 400 million barrels will be added to the oil market soon – what are strategic reserves and what can they do? https://theconversation.com/over-400-million-barrels-will-be-added-to-the-oil-market-soon-what-are-strategic-reserves-and-what-can-they-do-278370 Accessed: 2026-05-13T08:01:16.021376
[37] Crude Oil Price Forecast for 2026, 2027, 2028–2030 and ... https://www.litefinance.org/blog/analysts-opinions/oil-price-prediction-forecast/ Accessed: 2026-05-13T08:01:28.111199
[38] Crude Oil Forecast 2026: Will Prices Rise or Fall? | EBC Financial Group https://www.ebc.com/forex/crude-oil-forecast-2026-will-prices-rise-or-fall Accessed: 2026-05-13T08:01:28.111199
[39] Comparative Analysis of Monthly Reports on the Oil Market https://www.ief.org/news/comparative-analysis-of-monthly-reports-on-the-oil-market-71 Accessed: 2026-05-13T08:01:28.111199
[40] Oil Price Forecast 2026: What Experts Expect for Brent and WTI Crude Next https://www.livenewsworld.com/oil-price-forecast-2026/ Accessed: 2026-05-13T08:01:28.111199
[41] EIA forecasts lower oil prices in 2026 and 2027 due to persistent stock builds - U.S. Energy Information Administration (EIA) https://www.eia.gov/todayinenergy/detail.php?id=67164 Accessed: 2026-05-13T08:01:28.111199
[42] 2026 Oil Price Outlook: Geopolitics, Supply Risks, and Global Economic Impact | Gate Learn https://www.gate.com/learn/articles/2026-oil-price-outlook-geopolitics-supply-risks-and-the-global-economic-tug-of-war Accessed: 2026-05-13T08:01:28.111199
[43] IEA Raises Forecast of Global Oil Demand Growth in 2026 | OilPrice.com https://oilprice.com/Latest-Energy-News/World-News/IEA-Raises-Forecast-of-Global-Oil-Demand-Growth-in-2026.html Accessed: 2026-05-13T08:01:28.111199
[44] Oil Market Report - January 2026 – Analysis - IEA https://www.iea.org/reports/oil-market-report-january-2026 Accessed: 2026-05-13T08:01:28.111199
[45] Strait of Hormuz may not fully reopen until second half of 2026, Baker Hughes says https://www.cnbc.com/2026/04/24/strait-hormuz-baker-hughes-iran-war-oil-lng.html Accessed: 2026-05-13T08:02:43.364001
[46] Strait of Hormuz Live Tracker — Real-Time Shipping & Oil Crisis Monitor https://hormuzstraitmonitor.com/ Accessed: 2026-05-13T08:02:43.364001
[47] Re-Opening the Strait of Hormuz Won’t Restore the Status Quo | Tufts Now https://now.tufts.edu/2026/05/04/re-opening-strait-hormuz-wont-restore-status-quo Accessed: 2026-05-13T08:02:43.364001
[48] 2026 Strait of Hormuz campaign - Wikipedia
https://en.wikipedia.org/wiki/2026_Strait_of_Hormuz_campaign Accessed: 2026-05-13T08:02:43.364001
[49] Israel/US-Iran conflict 2026: Reopening the Strait of Hormuz - House of Commons Library https://commonslibrary.parliament.uk/research-briefings/cbp-10636/ Accessed: 2026-05-13T08:02:43.364001
[50] The Strait of Hormuz has been closed again as of April 18 ... https://www.facebook.com/marinophilippines/posts/update-the-strait-of-hormuz-has-been-closed-again-as-of-april-18-2026-following-/960459039921890/ Accessed: 2026-05-13T08:02:43.364001
[51] EIA Press Release (04/07/2026): Hormuz closure and related production outages are key drivers in EIA’s latest forecast https://www.eia.gov/pressroom/releases/press586.php Accessed: 2026-05-13T08:02:43.364001
[52] Strait of Hormuz 2026: Explainer
https://hormuzmonitor.com/strait-of-hormuz-2026-explainer/ Accessed: 2026-05-13T08:02:43.364001
[53] Israel/US-Iran conflict 2026: Reopening the Strait of Hormuz
https://researchbriefings.files.parliament.uk/documents/CBP-10636/CBP-10636.pdf Accessed: 2026-05-13T08:02:43.364001
[54] Strait of Hormuz Disruptions Implications for Global Trade and Development https://unctad.org/system/files/official-document/osgttinf2026d1_en.pdf Accessed: 2026-05-13T08:02:43.364001
[55] Iran Crisis Monitor #2 · 21 April 2026
https://www.crisisgroup.org/sites/default/files/2026-04/icg-icm-#2-21iv26_0.pdf Accessed: 2026-05-13T08:02:43.364001
[56] Strait of Hormuz Crisis 2026: Full Timeline & Ocean Freight Impact https://www.seavantage.com/blog/strait-of-hormuz-crisis-2026-shipping-disruption-timeline Accessed: 2026-05-13T08:02:43.364001
[57] The Strait of Hormuz in 8 Charts | CSIS https://www.csis.org/analysis/strait-hormuz-8-charts Accessed: 2026-05-13T08:02:43.364001
[58] Iran Conflict and the Strait of Hormuz: Impacts on Oil, Gas, ... https://www.congress.gov/crs_external_products/R/PDF/R45281/R45281.6.pdf Accessed: 2026-05-13T08:02:43.364001
[59] The Strait of Hormuz: Alternative routes for oil exporters https://www.cnbc.com/2026/04/23/strait-hormuz-closure-alternative-routes-middle-east-oil-gas-pipelines.html Accessed: 2026-05-13T08:02:53.061457
[60] Saudi, UAE, Iraq: Can three pipelines help oil escape Strait of Hormuz? | US-Israel war on Iran News | Al Jazeera https://www.aljazeera.com/economy/2026/3/27/saudi-uae-iraq-can-three-pipelines-help-oil-escape-strait-of-hormuz Accessed: 2026-05-13T08:02:53.061457
[61] Alternative Shipping Routes When Hormuz Is Blocked | Hormuz Strait Monitor https://hormuzstraitmonitor.com/alternative-routes/ Accessed: 2026-05-13T08:02:53.061457
[62] Strait of Hormuz Disruption: Can Gulf Pipelines and Alternative Routes Really Replace the Vital Oil Chokepoint? https://gulfnews.com/business/energy/what-backup-routes-can-gulf-countries-use-instead-of-strait-of-hormuz-1.500514461 Accessed: 2026-05-13T08:02:53.061457
[63] Saudi Aramco Oil Rerouting 2026: Hormuz Crisis Disrupts Global Supply https://fuelengineering.in/saudi-aramco-oil-rerouting-2026/ Accessed: 2026-05-13T08:02:53.061457
[64] World Oil Transit Chokepoints
https://www.eia.gov/international/analysis/special-topics/World_Oil_Transit_Chokepoints Accessed: 2026-05-13T08:02:53.061457
[65] Gulf states must invest in alternatives to the Strait of Hormuz | The National https://www.thenationalnews.com/business/energy/2026/03/30/gulf-states-must-invest-in-alternatives-to-the-strait-of-hormuz/ Accessed: 2026-05-13T08:02:53.061457
[66] Saudi Arabia diverts more crude to the Red Sea to bypass Hormuz, but alternative capacity remains limited — MercoPress https://en.mercopress.com/2026/03/17/saudi-arabia-diverts-more-crude-to-the-red-sea-to-bypass-hormuz-but-alternative-capacity-remains-limited Accessed: 2026-05-13T08:02:53.061457
[67] Strait of Hormuz Shipping Disruptions: Global Energy Crisis 2026 https://discoveryalert.com.au/strait-hormuz-shipping-disruptions-oil-lng-closure-2026/ Accessed: 2026-05-13T08:02:53.061457
[68] CO26093 | Alternatives to Hormuz: How to Export Oil and Gas from the Persian Gulf https://rsis.edu.sg/rsis-publication/rsis/co26093/ Accessed: 2026-05-13T08:02:53.061457
[69] 3-2-1 Crack Spread | Live Refining Margin Benchmark
https://www.energystockchannel.com/3-2-1-crack-spread/ Accessed: 2026-05-13T08:03:04.135765
[70] Crack Spread Calculator | Real-Time Refinery Margin Tool
https://www.oilpriceapi.com/tools/crack-spread-calculator Accessed: 2026-05-13T08:03:04.135765
[71] 3-2-1 Crack Spread | RBN Energy
https://rbnenergy.com/market-data/3-2-1-crack-spread Accessed: 2026-05-13T08:03:04.135765
[72] Crack Spreads and Refining Margins: The 3-2-1 Benchmark | Energy IB https://ibinterviewquestions.com/guides/energy-investment-banking/crack-spreads-refining-margins-3-2-1 Accessed: 2026-05-13T08:03:04.135765
[73] Using Crack Spread Data in Refinery Business Interruption Claims - Lexology https://www.lexology.com/library/detail.aspx?g=429d184e-9d94-410f-843c-8d42c13abb8e Accessed: 2026-05-13T08:03:04.135765
[74] Are “margins” and “crack spreads” communicating profit? ... https://www.afpm.org/print/pdf/node/40397 Accessed: 2026-05-13T08:03:04.135765
[75] 3-2-1 Crack Spread 2026: Refining Margins Explained — The Middle East Insider https://themiddleeastinsider.com/2026/03/29/3-2-1-crack-spread-march-2026-refining-margins/ Accessed: 2026-05-13T08:03:04.135765
[76] Commodity Portfolio Management Series - 1. Refinery Margin Insights: Decoding the Crack Spread https://www.theeasternarchivist.com/commodit/ Accessed: 2026-05-13T08:03:04.135765
[77] Gulf Coast refineries face margin squeeze as crude prices tumble - BIC Magazine https://www.bicmagazine.com/industry/refining-petrochem/gulf-coast-refineries-face-margin-squeeze/ Accessed: 2026-05-13T08:03:04.135765
[78] Crack spread - Wikipedia
https://en.wikipedia.org/wiki/Crack_spread Accessed: 2026-05-13T08:03:04.135765
[79] Announcement of Advanced Prices and Pricing Factors for May 2026 https://www.ams.usda.gov/mnreports/dymadvancedprices.pdf Accessed: 2026-05-13T08:03:04.135765
[80] Nextpower Q4 Earnings Call Highlights - Daily Political
https://www.dailypolitical.com/2026/05/12/nextpower-q4-earnings-call-highlights.html Accessed: 2026-05-13T08:03:04.135765
[81] Potential Price Changes in 2026 – AICC Now
https://now.aiccbox.org/potential-price-changes-in-2026/ Accessed: 2026-05-13T08:03:04.135765
[82] What Products Are Getting More Expensive in 2026?
https://www.aarp.org/money/personal-finance/prices-going-up/ Accessed: 2026-05-13T08:03:04.135765
[83] May 2026: Price Trajectory for All Resins Shifts Sharply Upward | Plastics Technology https://www.ptonline.com/articles/may-2026-price-trajectory-for-all-resins-shifts-sharply-upward Accessed: 2026-05-13T08:03:04.135765
[84] EUDR Simplification Package May 2026: 6 Things Companies Need to Know — TRACT https://www.tract.eco/news/eudr-simplification-package-2026 Accessed: 2026-05-13T08:03:04.135765
[85] Europe spot pricing goes into reverse as buyers push back ... https://www.icis.com/explore/resources/news/2026/04/30/11203086/insight-europe-spot-pricing-goes-into-reverse-as-buyers-push-back-amid-stagnant-downstream-demand Accessed: 2026-05-13T08:03:04.135765
[86] If You’re a Market Access Lead in 2026: How to Navigate the Toughest Pricing Pressures in a Decade https://remapconsulting.com/pricing/pharma-pricing-strategy-2026/ Accessed: 2026-05-13T08:03:04.135765
[87] Producer Price Index News Release summary - 2026 M03 Results https://www.bls.gov/news.release/ppi.nr0.htm Accessed: 2026-05-13T08:03:04.135765
[88] Commodity Price Watch: March 2026 | Seeking Alpha
https://seekingalpha.com/article/4884709-commodity-price-watch-march-2026 Accessed: 2026-05-13T08:03:04.135765
Causal Relationship Graph
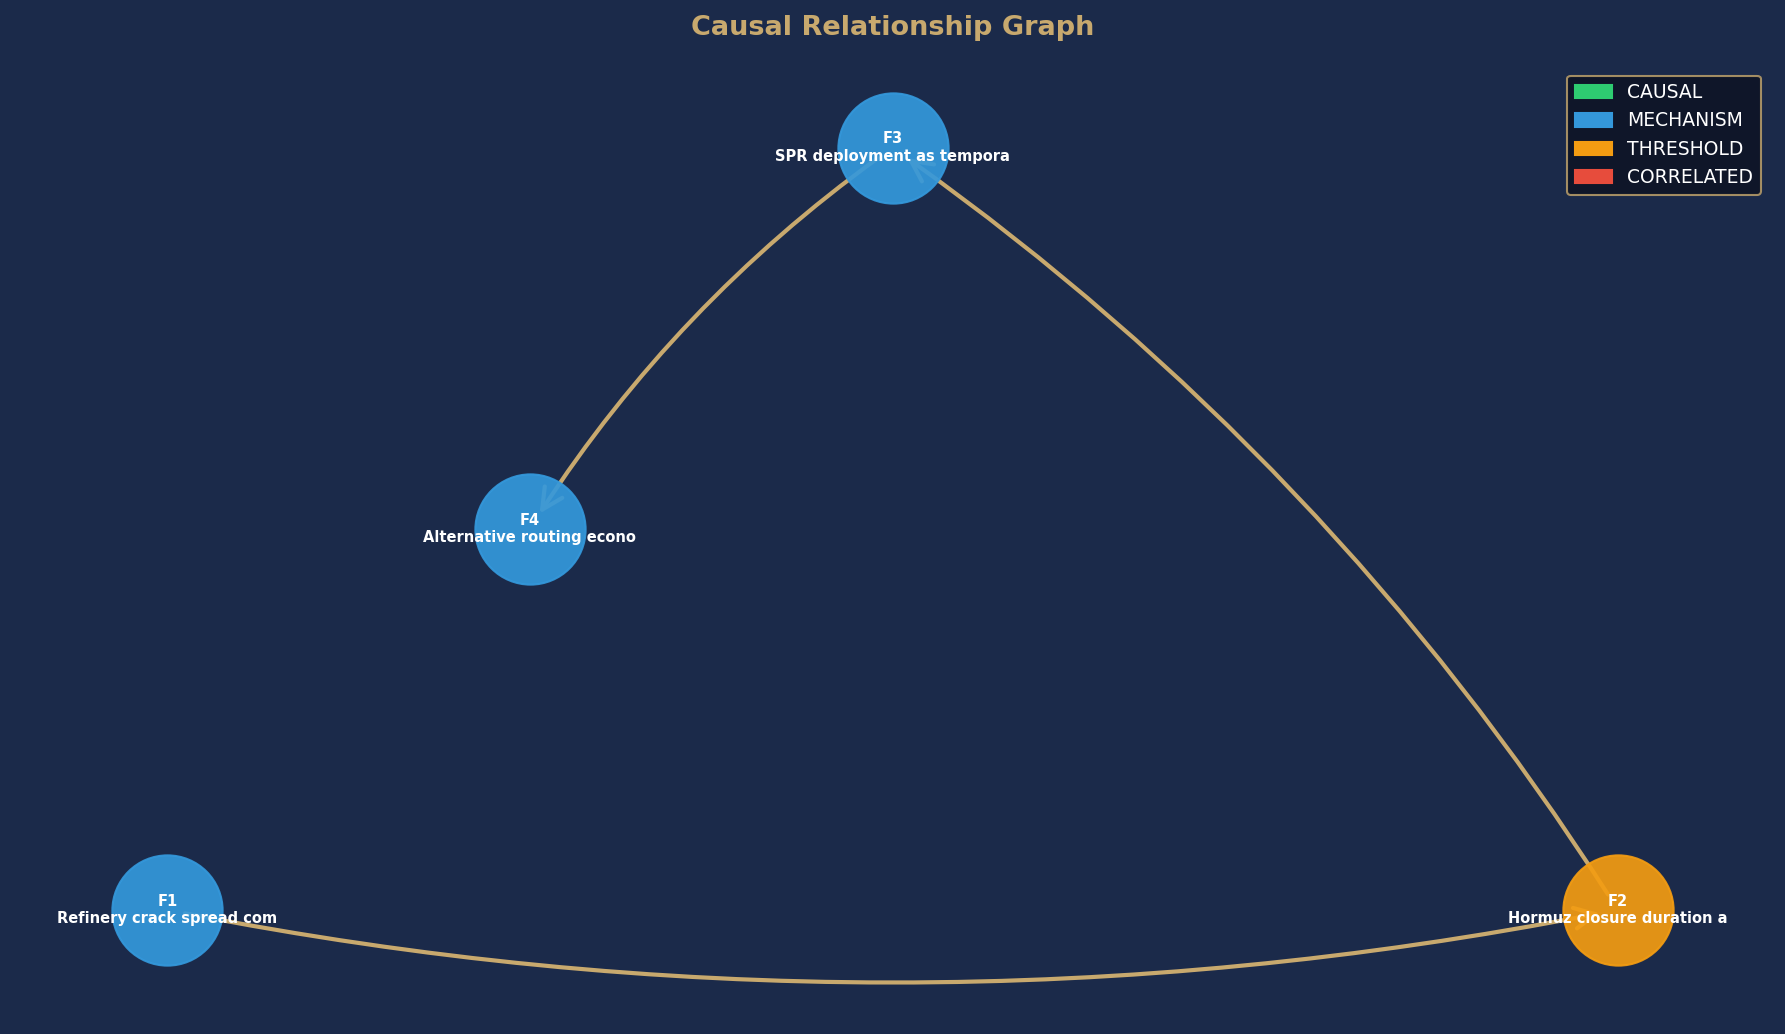
Node colors indicate causal confidence rating. Arrows show directional causal relationships identified in this analysis.
Finding Confidence Distribution
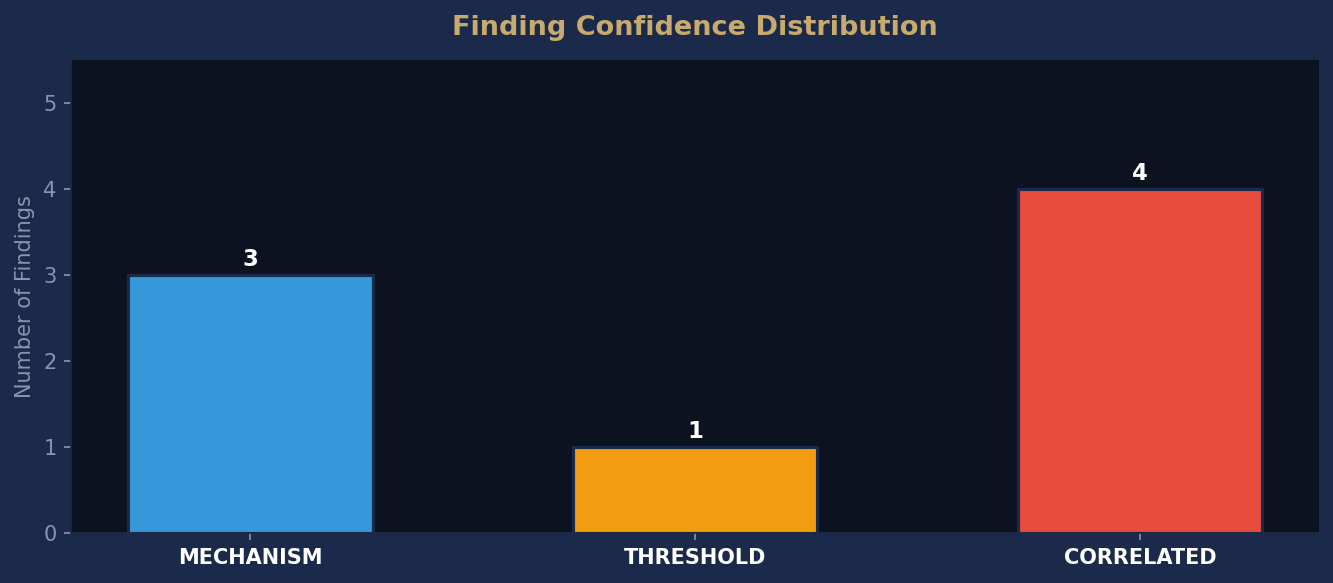
Distribution of causal confidence ratings across all findings in this report. CAUSAL findings are fully actionable. MECHANISM findings require additional evidence before action.
This report was published on May 13, 2026. By the time it's free, the market has already moved.
Don't miss the next one.
Don't miss the next one.
This report was published May 13, 2026. Current intelligence reports are available now.