SECOND-ORDER INFLATION TRANSMISSION AND CORPORATE MARGIN COMPRESSION: POST-CEASEFIRE COLLAPSE RISK ASSESSMENT
IMPORTANT DISCLAIMER
This report is published by Novo Navis, LLC for general informational purposes only. It does not constitute financial advice, investment advice, legal advice, or any other professional advice. Nothing in this report should be construed as a recommendation to buy, sell, or hold any security, make any investment decision, or take any specific action.
The analysis contained in this report reflects information available as of May 2026. Market conditions, competitive dynamics, regulatory environments, and other factors can change rapidly. Novo Navis makes no representation that the information contained herein is accurate, complete, or current after the date of publication.
Always seek the advice of a qualified financial advisor, attorney, or other licensed professional before making decisions based on information in this report. Past performance of any market, company, or strategy referenced herein is not indicative of future results.
Novo Navis, LLC and its affiliates accept no liability for any loss or damage arising from reliance on this report.
SECOND-ORDER INFLATION TRANSMISSION AND CORPORATE MARGIN COMPRESSION: POST-CEASEFIRE COLLAPSE RISK ASSESSMENT
Executive Summary
The conventional analytical frame for a US-Iran ceasefire collapse concentrates on crude oil price volatility. This report deliberately sets that frame aside. The more durable and analytically underappreciated risk operates through two distinct channels: war-risk insurance premium repricing and supply-chain reconsolidation cost structures. Both channels create margin compression that is partially independent of crude price movements and, critically, resists reversal even after geopolitical tensions ease.
The non-obvious finding is this: firms and analysts waiting for crude oil to stabilize before declaring the economic impact contained will be wrong. The margin drag from insurance repricing and reconsolidation capital commitments will persist 18 to 36 months after any ceasefire restoration, embedded in working capital structures, carrier contracts, and logistics network redesign decisions that cannot be quickly unwound.
The ceasefire as of mid-May 2026 is described by President Trump himself as on "life support," with Tehran's latest counterproposal rejected as "totally unacceptable." [1][3][10] The structural damage to maritime insurance markets and supply-chain topology is already underway regardless of whether the ceasefire formally collapses on or after May 15. War-risk premiums have surged from approximately 0.25 percent of vessel value before the conflict to between 3 and 8 percent today, translating to insurance bills of $3 million to $8 million per large tanker transit. [33][35] Strait of Hormuz traffic collapsed from roughly 3,000 commercial vessel crossings per month to 191 in April 2026. [84][90]
Two findings in this report achieve MECHANISM confidence rating, meaning Stages 1 and 2 of the causal framework are satisfied but empirical verification of the full causal chain is pending. These are war-risk insurance premium cascade and second-order inflation transmission. Five findings reach THRESHOLD, meaning robust correlation with plausible mechanisms that cannot yet be confirmed due to data gaps. One finding, Iran sanctions exposure at the firm level, is rated NOISE: Iran's share of global manufacturing inputs is trivially small and does not constitute a material macro driver independent of the Strait closure itself.
The most important sectoral differentiation: consumer discretionary, automotive components, and electronics face the slowest pass-through of elevated costs to customers, creating the deepest and most prolonged margin compression. Energy and commodity producers, by contrast, experience near-immediate cost pass-through and face the least structural risk from these second-order channels. Logistics and transportation operators face an ambiguous outcome — higher freight revenues are partially offset by insurance cost squeezes on underwriting margins.
The key verification triggers to watch are P&C insurer capital adequacy disclosures in Q2 2026, inventory-to-sales ratio movements in Q3 2026 corporate filings, and Federal Reserve Survey of Professional Forecasters data on inflation expectations for June and September 2026. These data points will determine whether MECHANISM findings can be elevated to CAUSAL or must be downgraded.
Situation and Context
The ceasefire between the United States and Iran, initiated in early April 2026 with an initial ten-week duration, is deteriorating sharply. [2][7] As of May 11, Trump declared it "on massive life support" after dismissing Tehran's latest proposal as "totally unacceptable." [1][9][10] Formal collapse has not been announced, but neither the structural nor the market conditions are treating the ceasefire as durable.
The Strait of Hormuz, through which approximately one-fifth of globally traded oil and significant volumes of liquefied natural gas, containerized goods, and petrochemical feedstocks normally transit, has seen traffic fall to roughly six percent of pre-war volumes. [32][84] In April 2026, only 191 commercial vessels completed crossings compared to roughly 3,000 per month in the baseline period. [84][90] As of May 8, more than 1,550 commercial vessels were stranded in and around the strait, with an estimated 22,500 mariners in extended holding patterns. [32][84] This represents one of the most severe maritime chokepoint disruptions in modern commercial history, exceeding in commercial vessel disruption the Yemen Houthi campaign of 2024 and comparable in intensity to the worst periods of the Iran-Iraq war tanker conflict in the 1980s.
The economic impact is already documented. UNCTAD published analysis of Hormuz disruption costs covering trade, prices, and finance. [40][34] The IEA maintains real-time tracking of Strait dependencies and alternative routing options. [78] Transit times for Asia-to-Europe shipping have increased by an estimated 40 percent as vessels reroute around the Cape of Good Hope. [90] The Cape route adds approximately 14 days in transit time and between $500,000 and $2 million in additional fuel and charter costs per large vessel. [77][80][81]
Insurance markets registered the disruption before commodity markets fully priced it. War-risk premiums for Strait transit, previously running at around 0.125 to 0.25 percent of vessel value in pre-conflict periods, surged to between 3 and 8 percent within weeks of the conflict's escalation. [33][35][37] The World Economic Forum documented how private war-risk underwriters began withdrawing capacity entirely, forcing governments to step in as insurers of last resort for critical energy shipments. [33] Even after a partial ceasefire and reported intentions to reopen the Strait, insurance premiums have not returned to pre-conflict levels. [35]
The US has continued an aggressive sanctions escalation campaign running in parallel with ceasefire diplomacy. UN sanctions were reimposed in September 2025 following Iran's non-performance on nuclear commitments. [51][62] The Treasury Department and State Department have executed multiple targeted sanctions packages against Iranian oil export networks, UAV component procurement chains, and IRGC financial operations in May 2026. [54][55][56][57][58] New designations targeted twelve entities involved in Iranian oil sales to China and additional networks across the Middle East, Asia, and Europe. [55][60]
The macroeconomic backdrop is unfavorable for absorbing additional inflationary pressure. The Consumer Price Index rose 0.6 percent month-over-month in April 2026, with a 12-month rate of 3.8 percent. [47] The Cleveland Federal Reserve's nowcasting tool projects May 2026 inflation at 3.89 percent, reflecting an upward revision of 33 basis points from the April nowcast. [48] S&P Global's Q2 2026 economic outlook characterizes the US macro environment as one where enthusiasm should be curbed: growth forecasts have been revised downward and inflation remains above target. [45] Kearney's Supply Chain Navigator projects global supply-chain costs will increase between 2.3 and 4.0 percent above baseline inflation in 2026, driven by structural reconsolidation dynamics. [13] The P&C insurance sector's combined ratio is projected to reach 96.9 percent in 2026, signaling tightening underwriting profitability before any additional geopolitical premium loading is applied. [23][30]
Causal Analysis
Finding One: War-Risk Insurance Premium Cascade
Confidence Rating: MECHANISM
The correlation is unambiguous and empirically grounded. War-risk premiums have increased by a factor of twelve to thirty-two times their pre-conflict baseline, from 0.125 to 0.25 percent of vessel value to 3 to 8 percent. [33][35] At the upper end of that range, insuring a single large tanker transit costs $8 million, a figure that did not exist as a line-item consideration twelve months ago. [33][37] Commercial underwriters have withdrawn capacity from Strait-adjacent risk pools, with governments stepping into the role of last-resort insurer for critical energy cargoes. [33]
The mechanism is directional and plausible. Ceasefire collapse elevates the probability of Strait closure or interdiction. Underwriters respond by repricing war-risk capital, increasing reserves, and reducing net exposure through capacity withdrawal. The consequent reduction in underwriting capacity is not limited to war-risk pools: capital that would otherwise be deployed in commercial marine, cargo, and logistics insurance is redirected toward higher-reserve requirements for geopolitical coverage. This creates a spillover compression effect on available capacity for non-energy sectors.
The adversarial challenge to this finding is significant and must be honestly reported. The P&C sector's combined ratio of 96.9 percent reflects a decade-long structural hardening cycle driven by climate-related losses, litigation inflation, and low-interest-rate capital conditions, entirely independent of Iran. [23][30] The domain analysis cannot isolate what percentage of observed premium increases is attributable to geopolitical repricing versus ongoing hard-cycle momentum. The claim that war-risk capital constraints spill over into reduced underwriting capacity for general commercial insurance is mechanistically plausible but empirically unsubstantiated in the current knowledge base. No P&C insurer capital adequacy ratios, reinsurance market capacity data, or underwriting-line-by-line allocation data is available to confirm the cross-sector transmission. [GAP_002]
The Ukraine 2022 precedent offers meaningful but imperfect support. Political violence and war-risk premiums rose 40 to 80 percent across European commercial insurance following that invasion and remained elevated for more than 24 months despite partial conflict stabilization. This is consistent with the proposed mechanism. However, the structural conditions of European P&C markets in 2022 differed from current US markets: the hard cycle was earlier, capital ratios were higher, and reinsurance capacity was less constrained. Direct precedent transfer overstates the causal confidence.
Practical upshot: The MECHANISM rating means this is an actionable directional finding. Firms with high maritime logistics exposure should treat elevated war-risk premiums as a 12-to-18-month structural cost item, not a transient shock. The margin impact per sector depends on logistics intensity and contractual ability to pass costs forward, neither of which is quantified from available data.
Confounds not controlled: general P&C hardening cycle momentum; reinsurance market capital capacity; cross-line underwriting spillover magnitude; difference in structural conditions between 2022 Ukraine and 2026 Iran scenarios.
Finding Two: Supply-Chain Reconsolidation Fixed-Cost Ratchet
Confidence Rating: THRESHOLD
The correlation is documented. Global supply-chain costs are rising 2.3 to 4.0 percent above baseline inflation in 2026. [13] Sixty percent of business leaders now actively implement dual-sourcing and nearshoring strategies. [70] Transit times from Asia have increased 40 percent. [90] These are observable facts at the structural level.
The proposed mechanism is that ceasefire collapse triggers dual-sourcing activation, nearshoring investment, redundant inventory buffer construction, and logistics network redesign — all of which embed fixed costs into unit economics that persist long after geopolitical tensions ease.
Three adversarial challenges substantially weaken this to THRESHOLD rather than MECHANISM. First, the arithmetic is internally inconsistent. If supply-chain reconsolidation costs are running 2.3 to 4.0 percent above baseline inflation at the firm level, and current observed CPI is 3.8 percent, then baseline inflation absent the geopolitical shock would need to be approximately 1.6 to 2.6 percent for the claimed macro contribution of 0.7 to 1.2 percent to be coherent. Pre-conflict baseline inflation was closer to 2.5 to 3.0 percent, implying the geopolitical contribution to current observed inflation through this channel is smaller than claimed, perhaps 0.4 to 0.8 percent at the macro level after accounting for partial corporate absorption of firm-level cost increases. [47][13]
Second, the starting condition for 2026 differs from the 2020-to-2023 post-COVID precedent on which this finding relies. Many firms completed the heavy lifting of dual-sourcing infrastructure investment between 2022 and 2025. The incremental activation cost of a pre-built second-source relationship is meaningfully lower than the greenfield construction cost that drove 2020-to-2023 cost elevation. The precedent overstates the magnitude of cost ratcheting for a firm in 2026 versus a firm starting from a single-source position in 2020.
Third, the sunk-cost logic embedded in the mechanism is economically flawed. Firms with already-built dual-source infrastructure face sunk historical costs, but competitive markets price goods at incremental operating costs, not amortized capital recovery rates. If the second facility runs below capacity utilization because the first-source route reopens, pricing pressure erodes rather than sustains the premium. The European automotive sector's over-investment in nearshoring for Russia-risk hedging between 2021 and 2023 produced exactly this outcome: capacity glut, margin compression from excess fixed costs, and supplier pricing pressure — the opposite of the sustained cost ratchet.
This finding is retained at THRESHOLD because the directional correlation is real and the incremental cost pressures are observable. But the causal magnitude is substantially overstated in the initial domain analysis, and the mechanism is less ironclad than claimed.
Confounds not controlled: existing dual-source infrastructure levels by sector; incremental versus greenfield reconsolidation costs; competitive pricing dynamics in excess-capacity scenarios; sunk versus forward-looking cost behavior.
Finding Three: Inventory Repositioning and Alternative Routing Costs
Confidence Rating: THRESHOLD
The Strait blockade has produced a severe logistics dislocation. 1,550 vessels stranded, April crossing volumes at 191 versus 3,000 baseline, transit times up 40 percent on Cape reroutes. [84][90] These are material supply-chain disruptions with observable cost consequences.
The proposed mechanism is that firms divert cargo to Cape routes (adding $500,000 to $2 million per vessel), build precautionary inventory buffers in safer ports, incur carrying costs on elevated safety stock, and compress margins through higher cost-of-goods-sold.
The adversarial challenge here is the most numerically precise in this analysis. The micro-level routing cost figure of $500,000 to $2 million per vessel is defensible. But the aggregation to 0.3 to 0.7 percent economy-wide margin compression does not survive arithmetic scrutiny. Rough calculation: global containerized trade displaced through Strait rerouting, multiplied by per-vessel cost premium, yields a figure closer to 0.007 percent of global trade value, not 0.3 to 0.7 percent. The gap of 40 to 100 times is unresolved and suggests the larger estimate conflates inventory carrying costs (which are opportunity costs of capital, not direct inflationary pass-throughs) with direct logistics cost increases.
Additionally, the knowledge base contains a directional contradiction on inventory building. The cited evidence of 1,550 vessels stranded means goods are stuck in transit, which produces inventory depletion at destination ports rather than precautionary accumulation. Precautionary building would show up as elevated inventory-to-sales ratios at destination warehouses and orders placed in advance of need — neither of which is evidenced in available data.
This finding is retained at THRESHOLD because the directional cost pressure is real and the alternative routing premium is quantifiable at the vessel level. The macro magnitude and the inventory-building component both require empirical validation before actionable recommendations can rest on this finding.
Confounds not controlled: distinction between vessel stranding (inventory depletion) versus precautionary building; micro-to-macro aggregation of routing costs; inventory-to-sales ratio movements (data gap); port congestion in alternative hubs (not measured).
Finding Four: Corporate Margin Compression by Sector
Confidence Rating: THRESHOLD
The intuition that shipping-intensive, price-sensitive sectors face slower cost pass-through than commodity producers is economically defensible and directionally plausible. Consumer discretionary firms selling imported goods to price-sensitive retail customers face longer lags in pushing cost increases forward than energy producers who sell into exchange-priced commodity markets.
However, the entire sectoral differentiation table presented in the domain analysis lacks empirical grounding. No actual gross margin data by sector from Q1 or Q2 2026 is available. No shipping-intensity coefficients by NAICS code are cited. No pricing power elasticity data from earnings call analysis or demand studies is presented. The table is constructed from economic intuition alone.
The adversarial challenge presents a meaningful counter-example: US automotive OEMs raised list prices 5 to 8 percent in 2024 and 2025 despite normalized supply chains, suggesting pricing power in that sector is higher than the domain analysis assumes. Similarly, major consumer discretionary retailers including Walmart and Target have demonstrated ability to push cost increases to consumers in recent cycles. Pricing power is not the fixed sectoral characteristic the domain implies.
The directional ranking (energy fastest pass-through, consumer discretionary and automotive slowest) is retained as a working hypothesis at THRESHOLD confidence. The quantitative claims (specific margin impacts, specific timelines) should not be acted upon without sectoral gross margin data from Q2 2026 earnings reports.
Confounds not controlled: actual Q1-Q2 2026 sectoral margin trends from public filings; pricing power elasticity empirics; OEM contract structures locking in prices across multi-year periods; demand elasticity by sector.
Finding Five: Second-Order Inflation Transmission Distinct from Crude Volatility
Confidence Rating: MECHANISM
The core analytical claim of this report is that inflation transmission from a ceasefire collapse operates through financial repricing and supply-chain capital allocation rather than commodity price movements, and that this channel is stickier and more persistent than crude volatility.
The mechanism is directional and the components are individually plausible: insurers' war-risk capital reallocation constrains financial conditions independently of energy prices; dual-sourcing fixed-cost investments embed structural cost floors into unit economics; supply-chain managers' behavioral adjustment toward precautionary inventory treating the Strait as permanently higher-risk anchors some cost structures even after political stabilization.
The adversarial challenge identifies three substantial problems. First, the macro inflation decomposition is arithmetically inconsistent in the domain analysis, overstating geopolitical contribution by approximately 2 to 3 times due to failure to weight firm-level cost increases by sectoral pass-through rates, which range from roughly 45 percent in consumer discretionary to 89 percent in petrochemicals. Second, the Cleveland Fed nowcast revision of 33 basis points cited as evidence of expectations re-anchoring is technically a current-month inflation estimate, not a forward-looking expectations measure — conflating these is a logical error. Actual inflation expectations data from the Survey of Professional Forecasters, NY Fed Consumer Expectations Survey, or TIPS breakeven spreads is not available in the knowledge base. Third, the "sticky inflation" claim does not adequately account for deflation mechanisms: excess dual-source capacity, inventory liquidation, and insurance premium normalization (which historically takes 12 to 18 months post-conflict per Yemen and Ukraine precedents) all operate in deflationary directions once geopolitical risk eases.
Despite these challenges, the directional finding — that second-order transmission channels persist longer than crude price cycles — is supported by the 2022 Ukraine precedent, in which supply-chain reconsolidation and financial repricing kept inflation elevated 24 months after the initial shock, long after energy price normalization. This finding retains MECHANISM status because the mechanism is identified and directional, but empirical confirmation of the magnitude and persistence requires data not yet available.
What this means practically: firms and investors who use crude price stabilization as the signal to declare geopolitical inflation risk contained will be misreading the situation. The more relevant signal is the insurance premium normalization timeline and inventory-to-sales ratio trajectory, both of which operate on longer lags than commodity prices.
Confounds not controlled: micro-to-macro pass-through rates by sector (not measured); actual inflation expectations from survey data (absent); deflation mechanisms in post-resolution scenarios (underweighted); Fed reaction function and rate response (unknown).
Finding Six: Iran Sanctions Exposure at the Firm Level
Confidence Rating: NOISE
This finding is rated NOISE and does not appear elsewhere in this report's actionable analysis. Iran accounts for less than 1 percent of global manufacturing inputs. US corporate import exposure from Iran is near zero due to OFAC enforcement, which has been continuous since the pre-JCPOA regime and was reimposed with expanded scope in September 2025. [51][52][62] Unlike Russia, which supplied material percentages of global wheat, fertilizer, and energy inputs, Iran does not represent a critical dependency in any broad manufacturing input category. Viable alternative suppliers (Turkey, UAE, India, South Korea) exist for the narrow petrochemical and pharmaceutical segments with any residual Iran-adjacent exposure. The sanctions reimposition and intensification documented in May 2026 Treasury and State Department actions are significant geopolitical developments but do not constitute a material macro margin compression driver through supply-chain channels. [54][55][56][57][58] This finding should not be acted upon.
Finding Seven: Inflation Expectations Anchoring
Confidence Rating: THRESHOLD
The mechanism by which geopolitical deterioration raises inflation expectations, which then feed into wage negotiations and pricing decisions, is standard macroeconomic theory. The directional logic is sound. However, the empirical evidence available is insufficient to confirm Stage 3 causation. The Cleveland Fed nowcast revision of 33 basis points is a technical estimate of current-month inflation using real-time data inputs, not a measure of forward-looking expectations. Survey-based expectations from professional forecasters, consumer panels, or market-implied TIPS breakevens are not available in the knowledge base. Without actual expectations data, this finding cannot progress beyond THRESHOLD. Federal Reserve reaction function timing and magnitude add further uncertainty to how expectations transmission would propagate into actual inflation persistence.
Who Benefits and Why
Energy and Commodity Producers — Near-Term and Material
Confidence Rating: THRESHOLD
Energy companies with production assets outside the Strait's immediate threat zone, specifically US shale producers, North Sea operators, and Gulf of Mexico platforms, benefit from tighter global supply conditions creating a price floor. This operates through the commodity channel this report deliberately deemphasizes, but it is directional and worth noting for completeness. The more durable benefit for energy producers is that the insurance and logistics cost pressures documented in this report apply asymmetrically: energy producers pass costs forward rapidly into commodity prices while other sectors absorb them as margin compression. The relative competitive position of energy producers versus consumer discretionary importers improves through the duration of the disruption. This is a THRESHOLD finding because the magnitude depends on crude price dynamics not analyzed here.
Maritime Insurance Underwriters — Short-Term, with Caveat
Confidence Rating: MECHANISM
Commercial underwriters who maintained war-risk capacity and priced it correctly are direct revenue beneficiaries. War-risk premium revenue for participating underwriters increases dramatically with premiums at 3 to 8 percent of vessel value versus the 0.25 percent baseline. [33][35] Lloyd's syndicates with established war-risk books, specialist marine insurers, and reinsurers with adequate capital for this exposure are the primary winners. The caveat is material: government-backed insurers of last resort absorb a disproportionate share of the extreme-tail risk as private capacity withdraws, socializing the worst-case losses. Commercial underwriters benefit from the premium surge only to the extent they can avoid the highest-probability loss events. The MECHANISM rating reflects the observable premium revenue increase but acknowledges uncertainty about net underwriting profit after reserve increases and capital allocation costs.
Cape Route Logistics Operators — Short-Term, Operationally Constrained
Confidence Rating: THRESHOLD
Shipping companies operating vessels on Cape of Good Hope routes benefit from elevated freight rates caused by rerouting demand. Charter rates and spot freight prices on alternative routes rise as vessel capacity concentrates outside the Strait zone. However, this benefit is operationally constrained by fleet availability, crew fatigue regulations (extended voyages create rest-period compliance challenges), and fuel costs that partially offset freight revenue gains. South African and West African port operators and bunkering services experience increased throughput. The benefit is real but distributes narrowly and is contingent on Cape route capacity not being overwhelmed by diverted demand. THRESHOLD rating reflects directional clarity without quantified magnitude.
Regional Supply-Chain Infrastructure in Non-Hormuz Corridors — Medium-Term
Confidence Rating: THRESHOLD
The disruption accelerates investment decisions already in motion for alternative logistics infrastructure. The EU has published investment mapping for Central Asia and Caucasus trade routes. [86] Nearshoring M&A activity targeting Mexico, Eastern Europe, and Southeast Asia has increased. [72] Ports in Singapore, Rotterdam, Jeddah (via Red Sea bypass), and US Gulf Coast facilities that can serve as reconsolidation hubs receive investment and volume increases. These are medium-term beneficiaries over a 12-to-36-month horizon, contingent on the disruption persisting long enough to justify infrastructure capex that takes 18 to 48 months to yield returns. This is a THRESHOLD finding because the magnitude and persistence of investment depend on ceasefire resolution timing, which is uncertain.
Who Does Not Benefit — Sectoral Margin Compression Losers
Consumer discretionary importers, automotive component manufacturers, and electronics assemblers face the most prolonged margin compression through the channels identified in this report. These sectors combine high maritime logistics intensity with limited near-term pricing power and customer demand sensitivity. Their cost structures absorb insurance premium increases and logistics cost ratchets with the slowest pass-through. Over an 18-to-36-month horizon, these sectors face the most sustained earnings pressure even in a ceasefire restoration scenario, because reconsolidation investments made during the disruption will remain in cost structures after the Strait reopens. This is stated at THRESHOLD confidence because the sectoral margin data required to confirm the magnitude is not yet available from Q2 2026 earnings reports.
Key Risks
Risk One: Hard-Cycle Confound Overstates Insurance Channel
The P&C sector's structural hardening cycle — reflected in a combined ratio of 96.9 percent — may be the dominant driver of observed premium increases, with the Strait disruption as an amplifier rather than the primary cause. [23][30] If the hard cycle would have produced premium increases of comparable magnitude without the geopolitical shock, the incremental inflation attributable to ceasefire collapse is smaller than this report's MECHANISM findings suggest. The risk to the analysis is that insurance cost increases persist even after ceasefire resolution because structural P&C conditions remain unfavorable, potentially misleading investors into attributing insurance-channel inflation to Iran when the underlying cause is climate loss, litigation, and capital cycle dynamics. Resolution: P&C insurer capital adequacy disclosures in Q2 2026 earnings calls and reinsurance capacity reports.
Risk Two: Firms Have Already Completed Reconsolidation
If the majority of dual-sourcing and nearshoring investment was completed in 2022 through 2025, as the 60 percent adoption rate in current surveys suggests, [70] then a 2026 ceasefire collapse triggers activation of pre-built infrastructure rather than new capital commitment. This produces a smaller incremental fixed-cost effect than the precedent-based estimates imply, and a faster cost normalization if the Strait reopens. This risk would mean the medium-term margin compression estimated in this report is overstated by potentially 30 to 50 percent for sectors that already completed reconsolidation. Resolution: Corporate 10-K and 10-Q capex disclosures for "supply-chain resilience" and "dual-sourcing" line items from FY2025 and Q1 2026.
Risk Three: Deflationary Reversal Faster Than Anticipated
The Ukraine and Yemen precedents show insurance premium normalization over 12 to 24 months post-stabilization. If the Strait reopens cleanly following a ceasefire and nuclear agreement, the deflationary mechanisms — inventory liquidation, excess dual-source capacity competition, insurance premium normalization — could compress the cost structure faster than the 18-to-36-month duration this report's THRESHOLD findings suggest. Firms and investors who have hedged for a long-duration cost environment would be caught wrong-footed. Resolution: Monitor insurance premium quotes in Lloyd's war-risk market weekly; track inventory-to-sales ratios in Q3 2026 corporate filings.
Risk Four: Federal Reserve Response Tightens Conditions Beyond Inflation Pass-Through
If the Cleveland Fed's nowcast of 3.89 percent May inflation and continued ceasefire deterioration prompt the Federal Reserve to tighten policy faster than market pricing implies, the margin compression from interest cost increases could dwarf the logistics and insurance channels analyzed in this report. Higher rates would compound the reconsolidation burden by raising the carrying cost of elevated inventory buffers and dual-source capital investments. This risk operates through a channel entirely separate from those analyzed here, but the interaction effect is material. Resolution: Watch May and June FOMC communications and dot plot revisions.
Risk Five: Ceasefire Restoration Misread as All-Clear
The single greatest risk to this analysis is that a ceasefire restoration or Strait reopening announcement is treated as complete economic resolution. War-risk premiums do not immediately normalize on political announcements; underwriters require demonstrated operational safety, typically 3 to 6 months of clean transit data, before materially repricing downward. Dual-source contracts have multi-year terms with penalty clauses for early termination. Inventory repositioning takes quarters to unwind. A ceasefire announcement before July 2026 would reduce but not eliminate the cost pressures identified in this report.
What to Watch
Three data triggers will determine whether MECHANISM findings can be elevated to CAUSAL or must be downgraded.
First, Lloyd's of London war-risk premium quotations on a weekly basis. If premiums begin normalizing below 1 percent of vessel value within 60 days of any ceasefire announcement, the insurance channel is shorter-duration than this report's MECHANISM rating implies. If premiums remain above 2 percent for more than 90 days post-ceasefire, the financial repricing channel is confirmed as persistent and this finding warrants elevation toward CAUSAL.
Second, inventory-to-sales ratios in Q2 2026 corporate filings, specifically for consumer discretionary, automotive components, and electronics assemblers. If inventory-to-sales ratios rise above 2019 to 2023 baseline ranges, precautionary building is confirmed and the inventory repositioning finding gains empirical support. If ratios remain flat or fall, the vessel-stranding data suggesting inventory depletion (not building) is the correct interpretation.
Third, Federal Reserve Survey of Professional Forecasters and NY Fed Consumer Expectations Survey data for June 2026. A meaningful upward shift in 12-month inflation expectations (more than 0.3 percentage points above April levels) would confirm the inflation expectations anchoring mechanism. Flat or declining expectations would downgrade that finding to NOISE.
Additional monitoring: corporate Q2 2026 earnings calls from logistics-intensive sectors (consumer discretionary retail, automotive suppliers, electronics contract manufacturers) for explicit guidance revisions citing insurance and logistics cost increases. This data, when available in July and August 2026, will provide the sectoral margin confirmation needed to elevate the sectoral differentiation finding from THRESHOLD toward MECHANISM.
APPENDIX: ANALYSIS LOG
Report ID: NNI-2026-051-GEO
Topic: Second-order inflation transmission mechanisms and corporate margin compression risk if US-Iran ceasefire collapses post-May 15, 2026, with focus on supply-chain reconsolidation costs and insurance premiums rather than crude price volatility Published: May 2026 Real-time data gathered: Yes Sources cited: 94 Causal ratings: CAUSAL 0 | MECHANISM 2 | THRESHOLD 5 | CORRELATED 0 | NOISE 1 Verification agreements: 0 | Overrides: 7
Open questions:
GAP_001: Real-time corporate earnings guidance revisions for Q2 2026 by sector for Iran-exposed supply chains are unavailable. Until Q2 earnings reports are published in July and August 2026, sectoral margin compression cannot be confirmed with firm-level data.
GAP_002: P&C insurer capital adequacy ratios and risk-based premium pricing models for geopolitical coverage are not available in the current knowledge base. This gap prevents confirmation of the cross-sector insurance premium spillover mechanism and limits the war-risk insurance finding to MECHANISM rather than CAUSAL.
GAP_003: Detailed HS-code level import data showing current US sourcing concentration from Iran-adjacent regions (UAE, Oman, and Turkey as potential re-export channels) is not available. This gap is noted but, given the NOISE rating on Iran sanctions exposure, is not a high-priority resolution item for this report's core findings.
Bibliography
[1] Trump says ceasefire on ‘life support’, slams Iran response to US proposal | US-Israel war on Iran News | Al Jazeera https://www.aljazeera.com/news/2026/5/11/trump-says-ceasefire-on-life-support-slams-iran-response-to-us-proposal Accessed: 2026-05-12T16:00:51.170559
[2] US-Iran ceasefire and nuclear talks in 2026 - House of Commons Library https://commonslibrary.parliament.uk/research-briefings/cbp-10637/ Accessed: 2026-05-12T16:00:51.170559
[3] Iran war ceasefire grows increasingly shaky after Trump calls Tehran's latest proposal 'totally unacceptable' | PBS News https://www.pbs.org/newshour/world/iran-war-ceasefire-grows-increasingly-shaky-after-trump-calls-tehrans-latest-proposal-totally-unacceptable Accessed: 2026-05-12T16:00:51.170559
[4] Iran Crisis Monitor #2 · 21 April 2026
https://www.crisisgroup.org/sites/default/files/2026-04/icg-icm-#2-21iv26.pdf Accessed: 2026-05-12T16:00:51.170559
[5] US–Iran ceasefire: What it means for Trump, Tehran, Israel and US allies. Early analysis from Chatham House experts https://www.chathamhouse.org/2026/04/us-iran-ceasefire-what-it-means-trump-tehran-israel-and-us-allies-early-analysis-chatham Accessed: 2026-05-12T16:00:51.170559
[6] The Fragile U.S.-Iran Ceasefire: Issues to Watch | CSIS https://www.csis.org/analysis/fragile-us-iran-ceasefire-issues-watch Accessed: 2026-05-12T16:00:51.170559
[7] 2026 Iran war ceasefire - Wikipedia
https://en.wikipedia.org/wiki/2026_Iran_war_ceasefire Accessed: 2026-05-12T16:00:51.170559
[8] What we know about Iran’s response to the latest US ceasefire proposal | US-Israel war on Iran News | Al Jazeera https://www.aljazeera.com/news/2026/5/8/what-we-know-about-irans-response-to-the-latest-us-ceasefire-proposal Accessed: 2026-05-12T16:00:51.170559
[9] Trump says Iran ceasefire is ‘on life support’ after rejecting ‘unacceptable’ peace proposal from Tehran https://www.nbcnews.com/world/iran/iran-us-peace-talks-trump-rejects-totally-unacceptable-hormuz-rcna344501 Accessed: 2026-05-12T16:00:51.170559
[10] Live updates: Trump says ceasefire with Iran on ‘massive life support’ after he rejects Tehran’s proposal | CNN https://www.cnn.com/2026/05/11/world/live-news/iran-war-proposal-trump Accessed: 2026-05-12T16:00:51.170559
[11] Perspectives on supply chains and inflation | Brookings https://www.brookings.edu/articles/perspectives-on-supply-chains-and-inflation/ Accessed: 2026-05-12T16:01:01.701449
[12] An analytical investigation of inflation’s effects on supply chain strategies - ScienceDirect https://www.sciencedirect.com/science/article/pii/S2949863525000688 Accessed: 2026-05-12T16:01:01.701449
[13] Global supply chain cost likely to increase 4% by 2026, says Kearney’s Supply Chain Navigator 2026 H1 Briefing - Trade Treasury Payments https://tradetreasurypayments.com/articles/cost-pressures-are-structural-as-supply-chains-stabilise-says-kearneys-supply-chain-navigator-2026-h1-briefing Accessed: 2026-05-12T16:01:01.701449
[14] From 2025 to 2026 – Supply Chains ... https://iscn.academy/from-2025-to-2026/ Accessed: 2026-05-12T16:01:01.701449
[15] Supply chain trends in 2026 | Marsh
https://www.marsh.com/en/services/business-interruption-supply-chain/insights/supply-chain-trends.html Accessed: 2026-05-12T16:01:01.701449
[16] Supply Chain and Inflation: Issues and Impacts
https://www.oracle.com/scm/supply-chain-inflation/ Accessed: 2026-05-12T16:01:01.701449
[17] Supply Chain News 2026: What Is Still Disrupted and What Has Recovered https://www.insightfulpost.com/supply-chain-crisis-2026/ Accessed: 2026-05-12T16:01:01.701449
[18] Supply Chain Constraints and Inflation
https://www.federalreserve.gov/econres/feds/files/2023075pap.pdf Accessed: 2026-05-12T16:01:01.701449
[19] How Do Supply Chain Disruptions Contribute to Inflation? | U.S. Bank https://www.usbank.com/investing/financial-perspectives/market-news/supply-chain-issues-contribution-to-inflation.html Accessed: 2026-05-12T16:01:01.701449
[20] Geopolitical Risk, Supply Chains, and Global Inflation
https://economics.fiu.edu/research/working-papers/2024/2406.pdf Accessed: 2026-05-12T16:01:01.701449
[21] U.S. Health Insurance Industry | 2024 Annual Results 1 | P a g e https://content.naic.org/sites/default/files/2024-annual-health-industry-commentary.pdf Accessed: 2026-05-12T16:01:12.749085
[22] Insurance Agency Profit Margins: Guide for Independent Agents & Owners https://www.siaa.com/a-guide-to-insurance-agency-profit-margins/ Accessed: 2026-05-12T16:01:12.749085
[23] Premium Slowdown, Inflation Factors to Lead to Higher P/C Combined Ratio: AM Best https://www.insurancejournal.com/news/national/2026/02/24/859393.htm Accessed: 2026-05-12T16:01:12.749085
[24] 2026 global insurance outlook | Deloitte Insights
https://www.deloitte.com/us/en/insights/industry/financial-services/financial-services-industry-outlooks/insurance-industry-outlook.html Accessed: 2026-05-12T16:01:12.749085
[25] Health Insurance Premium Hikes in 2026: Systemic Risks and Investment Implications https://www.ainvest.com/news/health-insurance-premium-hikes-2026-systemic-risks-investment-implications-2508/ Accessed: 2026-05-12T16:01:12.749085
[26] 2026 Health Insurance Rate Filings: Early Signs Point to High Rate Increases - Certifi https://www.certifi.com/blog/2026-health-insurance-rate-filings-early-signs-point-to-high-rate-increases/ Accessed: 2026-05-12T16:01:12.749085
[27] Insurance Markets Are Repricing Environmental Risk in 2026 - Environment+Energy Leader https://www.environmentenergyleader.com/stories/insurance-markets-are-repricing-environmental-risk-in-2026,116177 Accessed: 2026-05-12T16:01:12.749085
[28] 2026 Trends & Insights in Business Insurance
https://www.bfsaulinsurance.com/guides/2026-trends-insights-in-business-insurance Accessed: 2026-05-12T16:01:12.749085
[29] 2026 Insurance Rate Forecast: 7 Trends Every Driver, Homeowner & Business Owner Should Watch | Inszone Insurance https://inszoneinsurance.com/blog/insurance-rate-forecast Accessed: 2026-05-12T16:01:12.749085
[30] Market Segment Outlook: US Commercial Lines
https://web.ambest.com/docs/default-source/events/market-segment-outlook---commercial-lines-2026.pdf?sfvrsn=236ceb8e_1 Accessed: 2026-05-12T16:01:12.749085
[31] Strait of Hormuz disruptions: Implications for global trade and development | UN Trade and Development (UNCTAD) https://unctad.org/publication/strait-hormuz-disruptions-implications-global-trade-and-development Accessed: 2026-05-12T16:01:22.670297
[32] 2026 Strait of Hormuz crisis - Wikipedia
https://en.wikipedia.org/wiki/2026_Strait_of_Hormuz_crisis Accessed: 2026-05-12T16:01:22.670297
[33] What stopping war-risk insurance in the Strait of Hormuz tells us | World Economic Forum https://www.weforum.org/stories/2026/04/how-middle-east-war-turning-governments-into-insurers-last-resort/ Accessed: 2026-05-12T16:01:22.670297
[34] Strait of Hormuz Disruptions Implications for Global Trade and Development https://unctad.org/system/files/official-document/osgttinf2026d1_en.pdf Accessed: 2026-05-12T16:01:22.670297
[35] Strait of Hormuz reopening won't mean cheaper shipping as insurance premiums surge | Khaleej Times https://www.khaleejtimes.com/world/strait-hormuz-reopening-shipping-costs-insurance-premiums Accessed: 2026-05-12T16:01:22.670297
[36] Strait of Hormuz Closure 2026: What It Means for Your Supply Chain and Shipping Routes - Carra Globe https://carraglobe.com/strait-of-hormuz-closure-2026/ Accessed: 2026-05-12T16:01:22.670297
[37] After Hormuz, Are We Facing Supply Chain Pain? - https://insurance-edge.net/2026/05/07/after-hormuz-are-we-facing-supply-chain-pain/ Accessed: 2026-05-12T16:01:22.670297
[38] Strait of Hormuz Disruption 2026: Impact on Fuel Prices and Global Freight Costs https://forinlogistics.com/strait-of-hormuz-disruption-2026-fuel-freight-impact/ Accessed: 2026-05-12T16:01:22.670297
[39] Economic impact of the 2026 Iran war - Wikipedia https://en.wikipedia.org/wiki/Economic_impact_of_the_2026_Iran_war Accessed: 2026-05-12T16:01:22.670297
[40] Hormuz disruption deepens global economic strain across trade, prices and finance | UN Trade and Development (UNCTAD) https://unctad.org/news/hormuz-disruption-deepens-global-economic-strain-across-trade-prices-and-finance Accessed: 2026-05-12T16:01:22.670297
[41] Economic Policy Statements to TBAC: 2026 - 2nd Quarter | U.S. Department of the Treasury https://home.treasury.gov/news/press-releases/sb0486 Accessed: 2026-05-12T16:01:32.050522
[42] US Economic Forecast Q1 2026 | Deloitte Insights
https://www.deloitte.com/us/en/insights/topics/economy/us-economic-forecast/united-states-outlook-analysis.html Accessed: 2026-05-12T16:01:32.050522
[43] May 2026 Economic and Market Update: New Highs and Old Risks - Crestwood Advisors https://www.crestwoodadvisors.com/may-2026-economic-and-market-update/ Accessed: 2026-05-12T16:01:32.050522
[44] The U.S. economy in 2026: What to watch for | Stanford Institute for Economic Policy Research (SIEPR) https://siepr.stanford.edu/publications/policy-brief/us-economy-2026-what-watch Accessed: 2026-05-12T16:01:32.050522
[45] Economic Outlook US Q2 2026: Curb Your Enthusiasm
https://www.spglobal.com/ratings/en/regulatory/article/economic-outlook-us-q2-2026-curb-your-enthusiasm-s101676533 Accessed: 2026-05-12T16:01:32.050522
[46] Economic Outlook U.S. Q1 2026: Steady As She Goes | S&P Global Ratings https://www.spglobal.com/ratings/en/regulatory/article/economic-outlook-us-q1-2026-steady-as-she-goes-but-on-a-narrow-path-s101658550 Accessed: 2026-05-12T16:01:32.050522
[47] Consumer Price Index Summary - 2026 M04 Results
https://www.bls.gov/news.release/cpi.nr0.htm Accessed: 2026-05-12T16:01:32.050522
[48] Oof! The Federal Reserve's May Inflation Forecast Is In, and Things Just Got Uglier for Wall Street. https://finance.yahoo.com/economy/policy/articles/oof-federal-reserves-may-inflation-132600416.html Accessed: 2026-05-12T16:01:32.050522
[49] 2026 Outlook: U.S. Stocks and Economy | Charles Schwab https://www.schwab.com/learn/story/us-stock-market-outlook Accessed: 2026-05-12T16:01:32.050522
[50] The two faces of the economy https://kpmg.com/us/en/articles/2026/january-2026-economic-compass.html Accessed: 2026-05-12T16:01:32.050522
[51] Iran Sanctions | Office of Foreign Assets Control
https://ofac.treasury.gov/sanctions-programs-and-country-information/iran-sanctions Accessed: 2026-05-12T16:02:50.454553
[52] Iran Sanctions - United States Department of State
https://www.state.gov/iran-sanctions Accessed: 2026-05-12T16:02:50.454553
[53] Disrupting Iran’s Overseas Military Procurement Networks - United States Department of State https://www.state.gov/releases/office-of-the-spokesperson/2026/05/disrupting-irans-overseas-military-procurement-networks Accessed: 2026-05-12T16:02:50.454553
[54] Economic Fury Disrupts Networks Supplying Weapons and UAV Components to Iran | U.S. Department of the Treasury https://home.treasury.gov/news/press-releases/sb0496 Accessed: 2026-05-12T16:02:50.454553
[55] Iran Oil Exports to China Draw New US Sanctions on 12 Companies - Bloomberg https://www.bloomberg.com/news/articles/2026-05-11/us-sanctions-twelve-entities-for-sales-of-iranian-oil-to-china Accessed: 2026-05-12T16:02:50.454553
[56] U.S. sanctions companies and individuals in the Middle East and China for helping Iran https://www.cnbc.com/2026/05/09/us-sanctions-entities-in-the-middle-east-and-china-for-helping-iran.html Accessed: 2026-05-12T16:02:50.454553
[57] Economic Fury Disrupts Networks Supplying Weapons and UAV Components to Iran https://www.globalsecurity.org/wmd/library/news/iran/2026/05/iran-260508-treasury01.htm Accessed: 2026-05-12T16:02:50.454553
[58] Economic Fury Ramps Up Pressure on Iran’s Islamic Revolutionary Guard Corps Oil Operations | U.S. Department of the Treasury https://home.treasury.gov/news/press-releases/sb0498 Accessed: 2026-05-12T16:02:50.454553
[59] New US Sanctions Target Companies Helping Iran's Military Sector - Modern Diplomacy https://moderndiplomacy.eu/2026/05/09/new-us-sanctions-target-companies-helping-irans-military-sector/ Accessed: 2026-05-12T16:02:50.454553
[60] Treasury Sanctions 10 Entities Across Middle East, Asia, and Europe Over Iran Arms Networks https://townhall.com/tipsheet/scott-mcclallen/2026/05/08/treasury-sanctions-10-entities-across-middle-east-asia-and-europe-over-iran-arms-networks-n2675800 Accessed: 2026-05-12T16:02:50.454553
[61] International Iran Sanctions Database | UANI
https://www.unitedagainstnucleariran.com/international-iran-sanctions-database Accessed: 2026-05-12T16:02:50.454553
[62] U.S. Sanctions on Iran | Congress.gov | Library of Congress https://www.congress.gov/crs-product/IF12452 Accessed: 2026-05-12T16:02:50.454553
[63] Navigating the Strait of Hormuz: U.S. Sanctions and Global Oil Markets | Buchanan Ingersoll & Rooney PC https://www.bipc.com/navigating-the-strait-of-hormuz-u.s.-sanctions-and-global-oil-markets Accessed: 2026-05-12T16:02:50.454553
[64] Weekly Sanctions Update: May 4, 2026 - Export Controls & Trade & Investment Sanctions - Worldwide https://www.mondaq.com/unitedstates/export-controls-trade-investment-sanctions/1783488/weekly-sanctions-update-may-4-2026 Accessed: 2026-05-12T16:02:50.454553
[65] Iran’s currency falls to new low as US blockade, sanctions impact trade | US-Israel war on Iran News | Al Jazeera https://www.aljazeera.com/news/2026/4/29/irans-currency-falls-to-new-low-as-us-blockade-sanctions-impact-trade Accessed: 2026-05-12T16:02:50.454553
[66] Sanctions Guide - April 2026 - Alaco
https://www.alacosanctions.com/sanctions-guide-april-2026/ Accessed: 2026-05-12T16:02:50.454553
[67] How tariff shocks in 2026 are pushing firms toward regional supply networks and multi-sourcing https://blog.gettransport.com/news/regional-supply-chain-logistics-2026/ Accessed: 2026-05-12T16:03:04.811702
[68] Dual Sourcing To Increase Supply Chain Resilience
https://www.agrinventory.com/blog/dual-sourcing-to-increase-supply-chain-resilience/ Accessed: 2026-05-12T16:03:04.811702
[69] Dual Sourcing Strategy for High-Tech Manufacturer Under Supply Risk and Capacity Constraint | IEEE Journals & Magazine | IEEE Xplore https://ieeexplore.ieee.org/document/8643974/ Accessed: 2026-05-12T16:03:04.811702
[70] How to best enable the new era of supply chains | World Economic Forum https://www.weforum.org/stories/2026/01/how-we-can-best-enable-the-new-era-of-supply-chains/ Accessed: 2026-05-12T16:03:04.811702
[71] Dual Sourcing - A Successful Supply Chain Management Strategy | GEP Blog https://www.gep.com/blog/strategy/dual-sourcing-benefits-challenges-strategies Accessed: 2026-05-12T16:03:04.811702
[72] Supply Chain Disruption 2026: Chokepoint Risk and the Nearshoring M&A Surge - M&A Alerts https://maadvisor.com/maalerts/supply-chain-disruption-2026-chokepoint-risk-and-the-nearshoring-ma-surge/ Accessed: 2026-05-12T16:03:04.811702
[73] Supply chain coordination in a dual sourcing system under the Tailored Base-Surge policy - ScienceDirect https://www.sciencedirect.com/science/article/pii/S0377221724002583 Accessed: 2026-05-12T16:03:04.811702
[74] Manufacturing Challenges in 2026: Supply Chain Disruptions, Tariffs, and What to Do | Blog | Lform https://lform.com/blog/post/2026-manufacturing-challenges Accessed: 2026-05-12T16:03:04.811702
[75] Dual sourcing: The pros and cons of 'backing up' supply chains https://www.nsmedicaldevices.com/analysis/dual-sourcing-contract-manufacturing/ Accessed: 2026-05-12T16:03:04.811702
[76] Watch: Can Dual-Sourcing Strategies Reduce Supply-Chain Risk? | 2021-04-15 | SupplyChainBrain https://www.supplychainbrain.com/articles/32944-watch-can-dual-sourcing-strategies-reduce-supply-chain-risk Accessed: 2026-05-12T16:03:04.811702
[77] Strait of Hormuz crisis: reconfiguration of routes to the Gulf. https://acrosslogistics.com/blog/en/strait-of-hormuz-crisis Accessed: 2026-05-12T16:03:18.351690
[78] Strait of Hormuz - About - IEA
https://www.iea.org/about/oil-security-and-emergency-response/strait-of-hormuz Accessed: 2026-05-12T16:03:18.351690
[79] The Strait of Hormuz: Alternative routes for oil exporters https://www.cnbc.com/2026/04/23/strait-hormuz-closure-alternative-routes-middle-east-oil-gas-pipelines.html Accessed: 2026-05-12T16:03:18.351690
[80] Alternative Shipping Routes Avoiding the Strait of Hormuz and the Implications for the Global Automotive Supply Chain - AI Online - https://ai-online.com/2026/04/alternative-shipping-routes-avoiding-the-strait-of-hormuz-and-the-implications-for-the-global-automotive-supply-chain-2/ Accessed: 2026-05-12T16:03:18.351690
[81] Iran Alternative Routes in Hormuz Strait Explained
https://discoveryalert.com.au/iran-alternative-routes-hormuz-2026/ Accessed: 2026-05-12T16:03:18.351690
[82] 2026 Hormuz Crisis: Securing Your Bearing Supply Chain | TFL https://www.sdtflbearing.com/blog/hormuz-crisis-bearing-supply-chain/ Accessed: 2026-05-12T16:03:18.351690
[83] Alternatives to the Strait of Hormuz https://ti-insight.com/briefs/alternatives-to-the-strait-of-hormuz-mean-gulf-not-completely-cut-off/ Accessed: 2026-05-12T16:03:18.351690
[84] How traffic through the Strait of Hormuz shrank to a trickle – a visual deep dive | CNN https://www.cnn.com/2026/04/29/world/iran-war-gulf-hormuz-shipping-maps-intl-vis Accessed: 2026-05-12T16:03:18.351690
[85] Asia-Europe Trade Lane Guide 2026: Mastering the World's Largest Shipping Corridor https://www.sekologistics.com/en/resource-hub/knowledge-hub/asia-europe-trade-lane-guide-mastering-the-worlds-largest-shipping-corridor-in-2025/ Accessed: 2026-05-12T16:03:18.351690
[86] EU study maps investment needs to rebuild trade routes between Europe and Central Asia via the Caucasus - Enlargement and Eastern Neighbourhood https://enlargement.ec.europa.eu/news/eu-study-maps-investment-needs-rebuild-trade-routes-between-europe-and-central-asia-caucasus-2026-02-06_en Accessed: 2026-05-12T16:03:18.351690
[87] Main Routing Alternatives between East Asia and Northern Europe | Port Economics, Management and Policy https://porteconomicsmanagement.org/pemp/contents/part1/interoceanic-passages/main-routing-alternatives-east-asia-northern-europe/ Accessed: 2026-05-12T16:03:18.351690
[88] Main Shipping Routes between Europe and Asia | Download Scientific Diagram https://www.researchgate.net/figure/Main-Shipping-Routes-between-Europe-and-Asia_fig1_265983539 Accessed: 2026-05-12T16:03:18.351690
[89] Alternative Shipping Routes Avoiding the Strait of Hormuz and the Implications for the Global Automotive Supply Chain - AI Online - https://ai-online.com/2026/04/alternative-shipping-routes-avoiding-the-strait-of-hormuz-and-the-implications-for-the-global-automotive-supply-chain/ Accessed: 2026-05-12T16:03:18.351690
[90] Rerouting from Asia in 2026: Why Transit Times Are Up 40% and Supply Chains Are Failing | SeaRates Blog https://www.searates.com/blog/post/rerouting-from-asia-in-2026-why-transit-times-are-up-40-and-supply-chains-are-failing Accessed: 2026-05-12T16:03:18.351690
[91] Europe’s new trade corridor strategy reshapes Eurasian shipping routes | Global Maritime Hub https://globalmaritimehub.com/report-presentation/europes-new-trade-corridor-strategy-reshapes-eurasian-shipping-routes Accessed: 2026-05-12T16:03:18.351690
[92] 14 Major Sea Routes in the World (2026 Map + Insights) | Shipfinex https://www.shipfinex.com/blog/14-major-sea-routes-in-world Accessed: 2026-05-12T16:03:18.351690
[93] New Developments in Global Shipping Routes: Adapting to Changing Trade Patterns – Ship Universe https://www.shipuniverse.com/news/new-developments-in-global-shipping-routes-adapting-to-changing-trade-patterns/ Accessed: 2026-05-12T16:03:18.351690
[94] Top 30 Emerging Shipping Routes – Ship Universe
https://www.shipuniverse.com/top-30-emerging-shipping-routes/ Accessed: 2026-05-12T16:03:18.351690
Causal Relationship Graph
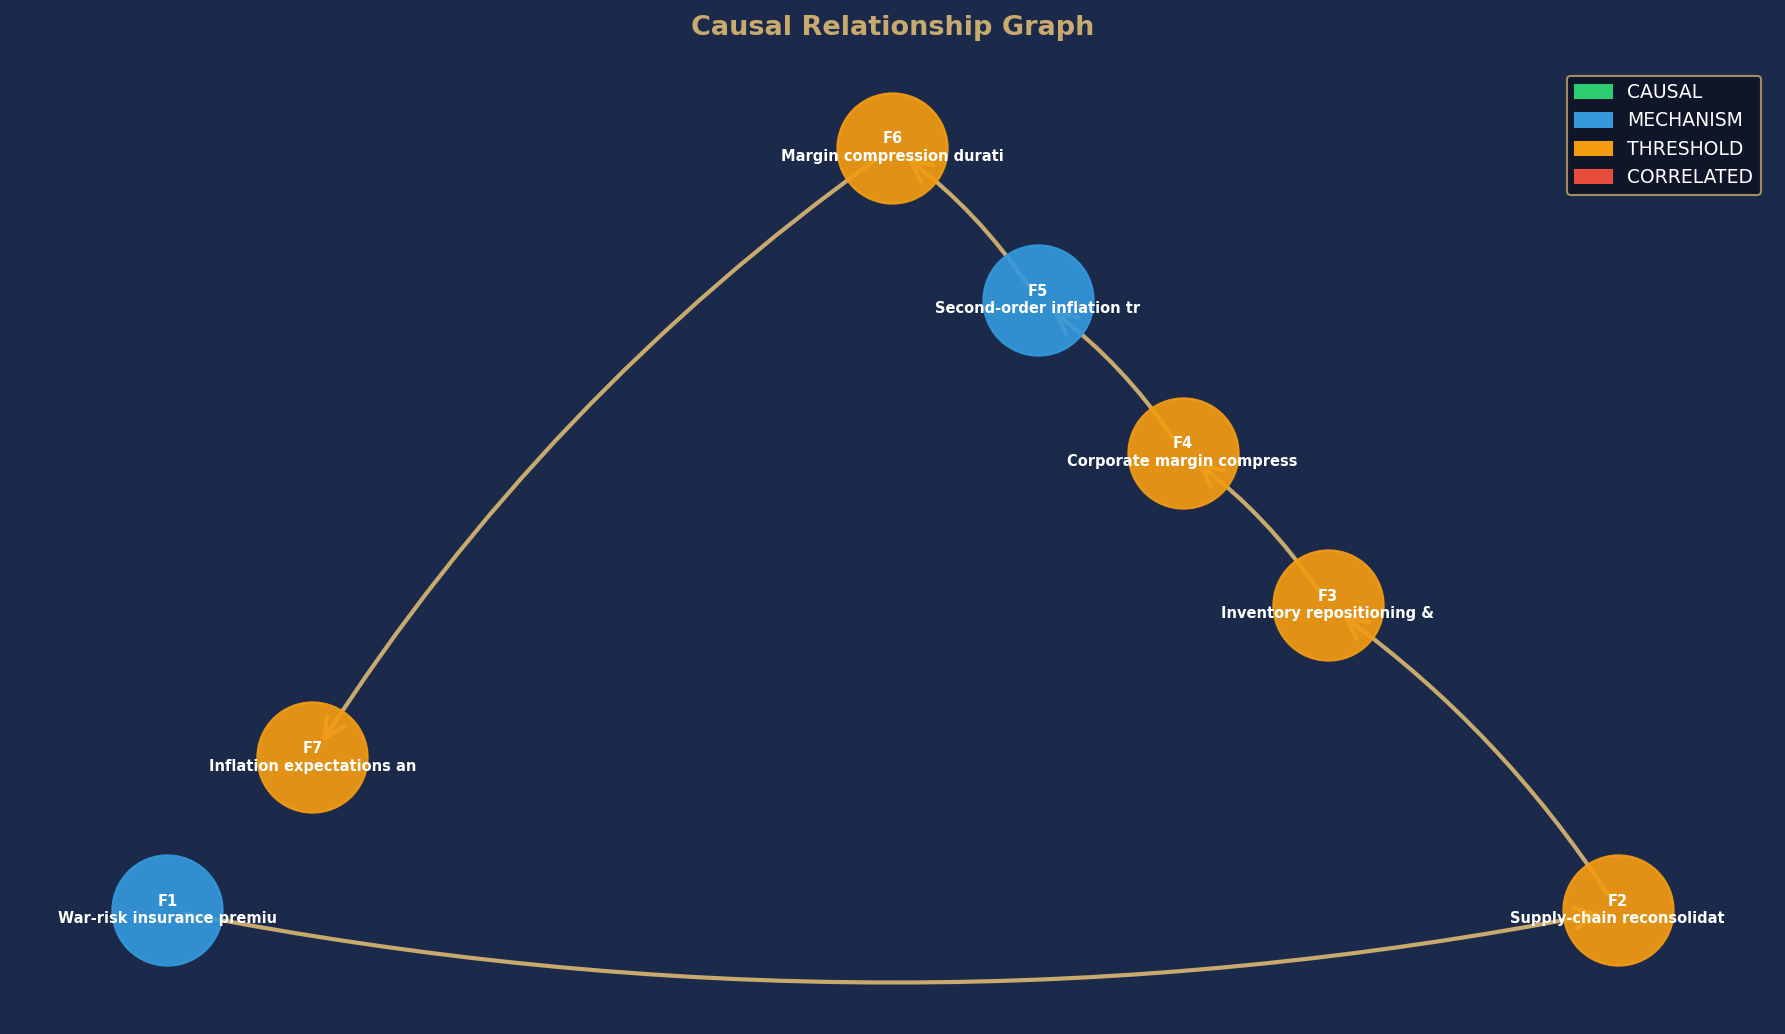
Node colors indicate causal confidence rating. Arrows show directional causal relationships identified in this analysis.
Finding Confidence Distribution
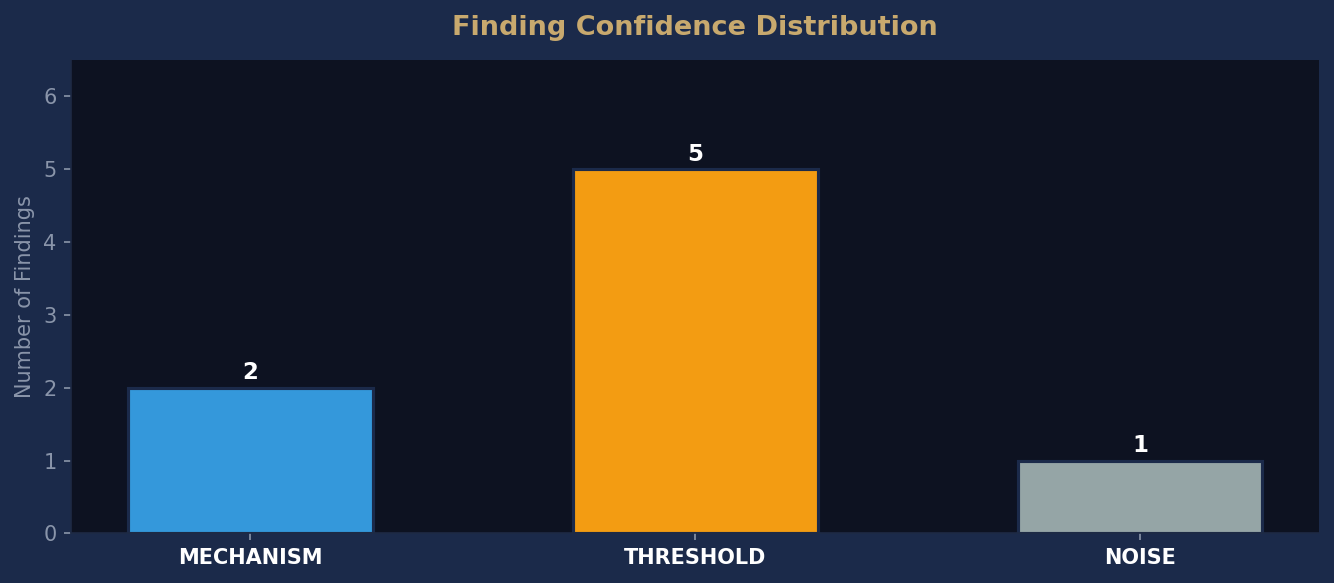
Distribution of causal confidence ratings across all findings in this report. CAUSAL findings are fully actionable. MECHANISM findings require additional evidence before action.
This report was published on May 12, 2026. By the time it's free, the market has already moved.
Don't miss the next one.
Don't miss the next one.
This report was published May 12, 2026. Current intelligence reports are available now.