FUEL SUPPLY CHAIN FAILURE SEQUENCE: PHYSICAL SHORTAGE MAPPING ACROSS PROCUREMENT TIERS AND SECTORS DURING THE 2026 STRAIT OF HORMUZ CRISIS
IMPORTANT DISCLAIMER
This report is published by Novo Navis, LLC for general informational purposes only. It does not constitute financial advice, investment advice, legal advice, or any other professional advice. Nothing in this report should be construed as a recommendation to buy, sell, or hold any security, make any investment decision, or take any specific action.
The analysis contained in this report reflects information available as of May 2026. Market conditions, competitive dynamics, regulatory environments, and other factors can change rapidly. Novo Navis makes no representation that the information contained herein is accurate, complete, or current after the date of publication.
Always seek the advice of a qualified financial advisor, attorney, or other licensed professional before making decisions based on information in this report. Past performance of any market, company, or strategy referenced herein is not indicative of future results.
Novo Navis, LLC and its affiliates accept no liability for any loss or damage arising from reliance on this report.
FUEL SUPPLY CHAIN FAILURE SEQUENCE: PHYSICAL SHORTAGE MAPPING ACROSS PROCUREMENT TIERS AND SECTORS DURING THE 2026 STRAIT OF HORMUZ CRISIS
Executive Summary
The non-obvious finding of this report is not that the Strait of Hormuz blockade has tightened global oil markets. Every newsroom is reporting that. The non-obvious finding is that the physical shortage is structurally uneven and temporally staggered in ways that the futures market is systematically misrepresenting, and that this misrepresentation is creating exploitable information asymmetries between buyer tiers.
The crisis has bifurcated the oil market into two distinct realities. Futures contracts for Brent and WTI are trading at roughly $100 to $102 per barrel, pricing in a relatively short disruption and an eventual Strait reopening. Physical crude cargo prices are clearing at $140 to $170 per barrel, pricing in sustained blockade risk. The $47 to $77 per barrel dislocation is not a technical artifact. It is the market's honest admission that it does not know how long the blockade lasts, and that physical barrels are genuinely scarce today regardless of what forward curves imply about next quarter. [23]
The analysis supported by the causal framework yields the following high-confidence findings.
First, and rated CAUSAL with high confidence, the Strait of Hormuz blockade has eliminated approximately 18 million barrels per day of global crude throughput. After accounting for demand destruction of roughly 2 to 3 million barrels per day and alternative supply substitution of 3 to 5 million barrels per day, the net effective depletion rate is 9 to 12 million barrels per day, not the 18 million barrels per day raw figure. This distinction is analytically critical and is the single most common analytical error in current market commentary. The supply shock is real; the assumption that it translates directly into a proportional binding shortage without price-mediated adjustment is not. [1] [47] [48]
Second, and rated CAUSAL with moderate confidence, European jet fuel inventories are approaching the International Energy Agency's critical 23-day shortage threshold and are projected to breach it in June 2026. This is the product category at greatest acute shortage risk, operating with inventory buffers one-fifth the size of crude inventories and exposed to a 20 to 25 percent production deficit. [89] [92] [93]
Third, the crisis is producing a procurement tier effect that concentrates losses on a specific buyer segment: mid-tier operators with term contracts expiring in May and June 2026 who must renew in a physical market priced $40 to $70 per barrel above their protected locked-in rates. However, the contract maturity calendar for this buyer segment is not empirically confirmed, and the magnitude of the pricing cliff depends on factors including demand destruction and blockade duration expectations at time of renewal. This finding is rated MECHANISM, not CAUSAL.
The practical implication for procurement managers and capital allocators is a 3 to 4 week window of acute pricing risk, centered on the period from mid-May through early June 2026, before demand destruction, supply substitution, and market adaptation begin to stabilize physical pricing. European airlines and Asian refiners dependent on light sweet crude feedstock face the sharpest near-term exposure. Strategic petroleum reserve releases are providing psychological market support but cannot mathematically offset the supply deficit at current release rates.
The analysis contains five open gaps that limit confidence in the sectoral timeline. These are identified throughout and summarized in the appendix.
Situation and Context
The 2026 Iran war began in late February 2026 following a US-Israeli air campaign against Iranian nuclear and military infrastructure. In response, Iran moved to close the Strait of Hormuz, the narrow waterway through which approximately 20 million barrels per day of crude oil and petroleum products transited before the conflict. [47] [48] Shipping traffic through the Strait collapsed to approximately 2 million barrels per day by March 2026, representing a 90 percent reduction in throughput. [4] [6]
The Strait is not replaceable on any operationally relevant timeline. The existing bypass infrastructure, principally the East-West Pipeline in Saudi Arabia and the Abu Dhabi Crude Oil Pipeline, has a combined capacity of approximately 5 to 7 million barrels per day, providing partial relief but leaving a net reduction in available seaborne supply of 13 to 15 million barrels per day even under optimal bypass utilization. [52]
Global oil inventories, as measured by days of supply, stood at approximately 101 days as of early May 2026, down from higher levels before the conflict. Goldman Sachs described inventories approaching an eight-year low, and the depletion velocity has been described as a specific concern separate from the absolute level. [3] The United States held approximately 409 million barrels in the Strategic Petroleum Reserve as of April 10, 2026, down from 413 million barrels in December 2025. [42] The Department of Energy authorized a coordinated emergency release program of 172 million barrels, currently in progress. [42] [44]
The IEA's April 2026 Oil Market Report confirmed the supply shock and identified the same regional asymmetry in its impact. [10] [53] The US EIA's April 2026 Short-Term Energy Outlook was published before the blockade reached its most severe phase and has been materially overtaken by events. [91]
Crude oil prices in the first quarter of 2026 increased sharply, a trajectory confirmed by the EIA's own retrospective assessment. [24] Physical crude cargo prices have since diverged substantially from futures settlements, with Brent futures near $100 to $102 and physical cargo transactions reportedly clearing at $140 to $170, depending on grade, delivery location, and counterparty. [23] This dislocation is the market structure that creates the procurement tier effects analyzed in this report.
The conflict's effect on fuel supply chains has not been uniform across geography or product type. Europe's jet fuel inventories have been specifically identified as approaching the IEA's critical 23-day shortage threshold, with a breach expected in June 2026. [89] [92] Approximately 20 to 25 percent of Europe's jet fuel supply has been disrupted by the conflict. [18] [93] [94] Asia-Pacific fuel markets are experiencing their own disruptions, with Middle East-linked shortages affecting transport, industrial, and energy security sectors across the region. [17] [19]
The Chevron chief executive and Goldman Sachs issued warnings in early May 2026 about the risk of physical oil shortages slowing global economies. [8] These warnings are notable because they distinguish between the financial market pricing of crude and the physical market availability of refined products, which is the same distinction this analysis is built around.
Refinery capacity utilization in the United States reached 94.8 percent as of December 2025, with crude processing at 17 million barrels per day and petroleum product exports at a record 6.6 million barrels per day. [30] [31] [33] The practical implication is that US refineries entered the crisis with minimal slack capacity to expand throughput in response to demand signals from shortage-affected regions. US jet fuel exports to Europe have increased since the blockade, but the scale of increase is insufficient to fully replace the missing Middle East-sourced volumes. [89]
Causal Analysis
FINDING 1: STRAIT OF HORMUZ BLOCKADE ELIMINATES 18 MB/D OF GROSS SUPPLY, WITH EFFECTIVE NET DEFICIT OF 9 TO 12 MB/D
Rating: CAUSAL
Confidence: 88 percent
The Strait of Hormuz carried approximately 20 million barrels per day of crude and petroleum product flows before the conflict. Post-blockade, flows fell to approximately 2 million barrels per day, a gross reduction of 18 million barrels per day. [4] [47] [48] This is the foundational supply shock underlying all downstream effects.
The mechanism is direct and empirically confirmed. Physical crude barrels that previously moved through the Strait cannot move. The blockade is not a pricing event or a sentiment event; it is a logistics event that physically prevents loading and discharge of tankers through the waterway. The US EIA and IEA data confirm the flow reduction. [10] [53]
The critical analytical correction to nearly all current market commentary is that the gross 18 million barrel per day figure overstates the net effective shortage. Three equilibrating mechanisms are operating simultaneously and are not priced into most shortage projections.
First, demand destruction. Oil demand is not perfectly inelastic. At physical clearing prices of $140 to $170 per barrel, demand elasticity of negative 0.2 to 0.3, applied to a 70 to 90 percent price shock above the pre-crisis baseline of roughly $75 to $80 per barrel, implies demand reductions of 10 to 20 percent. Global daily consumption near 100 million barrels per day means demand destruction of 2 to 3 million barrels per day is plausible within weeks of sustained high prices. [54]
Second, supply substitution. Alternative crude sources not transiting the Strait include Brazilian offshore production, West African grades, Norwegian North Sea, and US Gulf Coast exports. These cannot replace the full 18 million barrel per day deficit, but incremental ramp-up of 3 to 5 million barrels per day within four to eight weeks of the crisis onset is consistent with historical supply response data from prior shocks.
Third, strategic reserve releases. The coordinated IEA and bilateral emergency release programs, centered on the 172 million barrel US SPR authorization, are contributing approximately 1 million barrels per day to global supply. [42] This is a meaningful signal but a modest physical quantity against the gross deficit.
Net effective depletion rate, after these offsets, is approximately 9 to 12 million barrels per day, not 18 million barrels per day. This distinction extends the timeline to acute shortage events by roughly 50 to 100 percent relative to a naive calculation that ignores market adjustment.
The adversarial challenge to this finding identified that the original domain analysis attributed a binding shortage to the supply constraint without modeling these equilibrating forces. The causal finding is sustained because the supply shock is real and empirically confirmed, but the downstream timeline and magnitude findings must be adjusted accordingly.
FINDING 2: LIGHT SWEET CRUDE GRADE MISMATCH CREATES DIFFERENTIAL REFINERY EXPOSURE
Rating: MECHANISM
Confidence: 60 percent
The Strait of Hormuz carried a specific crude grade mix. Approximately 60 percent of flows were characterized as light sweet crude, with the remainder comprising medium and heavy sour grades from Iranian and Saudi fields. [56] [59] [60] The blockade therefore does not reduce all crude grades proportionally. It disproportionately removes light sweet crude from global circulation.
The mechanism hypothesized is directional: light sweet crude loss creates a grade-specific feedstock constraint for refineries configured to process light sweet inputs. Complex refineries in Japan, Singapore, and Northwest Europe were constructed to maximize yield from light sweet feedstocks and cannot substitute sour crude without throughput penalties, yield degradation, or capital reconfiguration. [62] [63]
The mechanism is theoretically sound. Refinery configuration is not infinitely flexible. The crude distillation unit, vacuum distillation, hydrotreater, and fluid catalytic cracker systems are engineered around specific API gravity and sulfur content parameters. A refinery optimized for 38 to 42 API gravity light sweet crude will experience yield penalties of 2 to 15 percent when switching to 20 to 25 API gravity heavy sour crude, depending on the extent of coking and upgrading capacity installed. [60]
The reason this finding is rated MECHANISM rather than CAUSAL is that the extent and binding nature of refinery grade-lock is not empirically confirmed in the May 2026 data. Modern complex refineries, which represent over half of global capacity, have coking units and hydrotreaters that allow partial sour crude processing. The throughput penalty may be 2 to 5 percent rather than the complete substitution failure the mechanism implies. Additionally, light sweet crude sourcing alternatives, including Brazilian pre-salt grades, West African Bonny Light, and US WTI exports, are available and would have been actively sought by affected refiners since March 2026.
What is empirically confirmed is that the supply shock exists and that refineries are experiencing feedstock constraints. What is not confirmed is that grade-specific lock-in is the binding constraint rather than overall crude scarcity, refinery throughput reduction from feedstock insufficiency, or higher-cost alternative sourcing eating into margins without causing physical shortage. Verification requires refinery-specific feedstock allocation data (Gap 003).
FINDING 3: JET FUEL TERMINAL DEPLETION IS THE MOST ADVANCED PHYSICAL SHORTAGE
Rating: CAUSAL
Confidence: 72 percent
Europe's commercial jet fuel inventories are approaching the IEA's critical 23-day shortage threshold, with a breach projected in June 2026. [89] [92] [93] [94] This is the most concretely quantified acute physical shortage in the current data, and it is operating on a trajectory that is substantially ahead of global crude inventory depletion.
The causal mechanism has three stages. First, crude supply reduction from the Strait blockade constrains refinery feedstock availability. Second, with feedstock constrained, refinery throughput falls, reducing production of all refined products including jet fuel. The reported production deficit for European jet fuel is approximately 20 to 25 percent. [18] [93] Third, jet fuel inventories operate on a fundamentally shorter buffer than crude inventories. Where global crude carries approximately 101 days of supply, European jet fuel commercial inventories carry approximately 20 to 25 days of supply in normal conditions. A 20 to 25 percent production deficit, against an inelastic aviation demand base in the near term, draws down terminal inventories at a rate that leads to the 23-day threshold breach.
A methodological caveat from the adversarial review is warranted. The original analysis characterized jet fuel as depleting 3.5 times faster than crude. This figure is a mathematical artifact of comparing two different metrics (global crude days of supply versus European jet fuel days of supply) rather than a genuine acceleration of depletion. The correct observation is that jet fuel has a much smaller absolute buffer and a proportionally significant production deficit, making the threshold breach timeline shorter. Terminal depletion is real and imminent; the quantification of relative rates should not be over-interpreted.
Three factors moderate the severity of the June threshold breach. US jet fuel exports to Europe have increased in response to the shortage, providing partial offset. [89] Aviation demand is exhibiting early signs of elasticity, with some route cancellations and load factor pressure that reduces fuel consumption below steady-state projections. [90] [95] Refineries in Europe and the US are prioritizing jet fuel in their product slates where feedstock allows.
The causal finding is sustained because: the production deficit is empirically confirmed, the inventory trajectory is publicly documented, and the IEA threshold breach is a consensus forecast from multiple independent sources. The June onset is a 30 to 45 day window from current date, within which the mechanism is operating.
FINDING 4: SPR RELEASE RATE IS INSUFFICIENT TO ARREST INVENTORY DEPLETION
Rating: MECHANISM
Confidence: 61 percent
The United States Strategic Petroleum Reserve held approximately 409 million barrels as of April 10, 2026, and is releasing oil under a coordinated emergency program authorized at 172 million barrels. [42] [44] [45] At the stated release program scale distributed over approximately 180 days, the release rate is approximately 1 million barrels per day.
The mechanism is directional and the mathematics are unambiguous: 1 million barrels per day of release against an 18 million barrel per day gross supply deficit represents a 5.6 percent offset. Even against the corrected net effective deficit of 9 to 12 million barrels per day, SPR releases represent an 8 to 11 percent offset. They extend the inventory depletion timeline marginally but cannot arrest it.
The finding is rated MECHANISM rather than CAUSAL because Stage 3 empirical confirmation of two key variables is pending. First, the actual delivery rate of SPR releases to refineries has not been independently confirmed at the full authorized rate. SPR releases flow through specific pipelines to specific refineries; the delivery chain has its own logistical constraints. Second, the geographic allocation of SPR releases matters. If US SPR barrels are primarily flowing to US Gulf Coast refineries, they provide limited direct relief to the European jet fuel shortage or the Asian refinery feedstock constraints that represent the acute shortage hotspots. Verification requires confirmation of SPR delivery rates and geographic routing (Gap 001, Gap 002).
The practical implication is that procurement managers should not anchor their risk models to SPR releases as a meaningful shortage mitigant. The signal effect of large SPR authorizations exceeds their physical impact. The 172 million barrel authorization is notable as a political and market confidence signal; the 1 million barrel per day delivery rate is insufficient as a physical supply solution.
FINDING 5: PHYSICAL-FUTURES PRICE DISLOCATION CREATES A PROCUREMENT TIER PRICING CLIFF
Rating: MECHANISM
Confidence: 50 percent
The global oil market has split into two distinct pricing realities. Futures contracts for Brent crude are settling at approximately $100 to $102 per barrel for near-month delivery. Physical cargo transactions are reportedly clearing at $140 to $170 per barrel. [23] This $47 to $77 per barrel dislocation represents the largest documented futures-physical spread in modern oil market history.
The mechanism creating differential buyer exposure is contractual structure. Buyers with term contracts signed before the March 2026 escalation of the crisis are, to the extent those contracts contain fixed or formula-based pricing, insulated from the physical market premium. Buyers whose term contracts expire in May or June 2026 and must renew face a binary choice: pay physical market pricing or go without supply. Buyers without term contracts, purchasing on spot or short-term basis, pay instantaneous clearing prices.
This creates a procurement tier structure. Tier 1 buyers, large integrated companies with pre-crisis locked-in terms, face minimal acute exposure. Tier 2 buyers, mid-tier operators renewing contracts in the May to June window, face the full physical-futures dislocation. Tier 3 buyers, spot market participants, pay peak pricing with no protection.
The finding is rated MECHANISM for a specific reason: the contract maturity calendar for the May to June 2026 period is not in the knowledge base. The analysis does not have empirical confirmation of which buyers have contracts expiring in this window, in what volumes, or at what actual renewal terms. The mechanism is directional and structurally sound but requires contract-level data verification to become CAUSAL (Gap 001). Additionally, major term contracts routinely include force majeure, price reopener, and extraordinary event clauses that could modify locked-in terms during a declared supply emergency, which would compress the Tier 1 protection assumed in this framework.
A further moderation: if futures markets are forward-looking and fully price in the anticipated June through August shortage, renewal contracts negotiated in May will incorporate those forward expectations, partially collapsing the timing asymmetry between physical and futures pricing. The dislocation may be real at the prompt level but narrow at the 60 to 90 day forward level where most renewals are priced.
FINDING 6: STORAGE TERMINAL CONGESTION AS AN INDEPENDENT SHORTAGE MECHANISM IS UNCONFIRMED
Rating: THRESHOLD
Confidence: 70 percent
A theoretically plausible but empirically unconfirmed finding concerns storage terminal congestion creating localized allocation failures independent of global price signals. The hypothesis is that crude supply scarcity, combined with high refinery utilization, creates competing pressures on storage terminals and pipeline throughput that manifest as delivery delays of 5 to 10 days, creating localized shortages even when global inventory levels have not breached critical thresholds.
The Stage 1 correlation is that high refinery utilization (94.8 percent as of December 2025) and reduced feedstock availability from the Strait blockade are observed simultaneously with reported infrastructure stress. The Stage 2 mechanism is logically sound: fixed-capacity pipeline systems and storage terminals cannot expand throughput on intra-month timescales, and competing demands for remaining cargo slots and dock access could create queue-driven delays.
The finding cannot advance beyond THRESHOLD for two reasons. First, no empirical data on actual terminal utilization rates, dock queue times, or pipeline throughput percentages at specific choke points (Amsterdam-Rotterdam-Antwerp terminal complex, Fujairah, Houston Ship Channel) is available in the knowledge base (Gap 002). Second, and importantly, the adversarial review identified that the direction of causality at storage terminals is ambiguous. If feedstock scarcity forces refineries to reduce throughput, their demand for pipeline and terminal services also falls, potentially relieving rather than intensifying congestion. The assumed direction (scarcity drives congestion) is not the only plausible direction.
This finding warrants urgent empirical data collection but should not be incorporated into procurement decisions as an established risk. If terminal congestion data confirms the hypothesized mechanism, this finding upgrades to MECHANISM and the localized shortage timeline would be compressed further relative to current projections.
Who Benefits and Why
INTEGRATED OIL MAJORS WITH UPSTREAM-DOWNSTREAM INTEGRATION AND PRE-CRISIS HEDGES
Rating: CAUSAL
Time horizon: Immediate through Q3 2026
The primary beneficiaries of the physical-futures price dislocation are entities that hold crude oil inventory in the physical market and can sell into the shortage. Integrated majors with upstream production assets in non-Strait-affected regions, including ExxonMobil, Shell, and BP in deepwater Gulf of Mexico and North Sea assets, are simultaneously selling physical crude at $140 to $170 per barrel while their hedging books may carry positions established at $70 to $80 per barrel. The net benefit is the physical-futures spread, captured directly. [8]
The mechanism is straightforward: upstream production cost is fixed in the near term; physical selling price has doubled. Margin per barrel has expanded dramatically. Companies with no exposure to Strait-transiting crude and with existing term supply contracts with buyers at pre-crisis pricing are the most exposed to margin capture.
The caveat is that some of this benefit is offset by downstream refinery feedstock costs rising for companies that also operate refineries dependent on Middle East crude. The net benefit is largest for companies with pure upstream exposure in non-Strait regions.
ALTERNATIVE CRUDE SOURCE EXPORTERS
Rating: MECHANISM
Time horizon: 30 to 90 days
Countries and companies producing light sweet crude outside the Strait are in a structural demand surplus. Brazilian pre-salt operators, Norwegian North Sea producers, West African exporters of grades including Bonny Light and Forcados, and US Gulf Coast crude exporters are receiving spot pricing requests at elevated premiums as Asian and European refiners seek substitutes for lost Middle East supply. [56] [62]
The benefit mechanism requires supply ramp-up, which takes time. Brazilian pre-salt fields cannot increase production overnight; drilling and completion backlogs limit near-term output growth. However, within the 60 to 90 day window, incremental volumes of 1 to 3 million barrels per day from these sources are achievable, and the sellers capture the premium pricing window. This finding is MECHANISM because the ramp-up volume and timeline are not empirically confirmed.
US REFINERY OPERATORS
Rating: MECHANISM
Time horizon: Immediate through Q2 2026
US refineries entered the crisis at near-maximum utilization processing light sweet WTI crude, and the US is not a Strait-transit-dependent crude importer. US refineries therefore face less feedstock disruption than their European and Asian counterparts. Additionally, elevated petroleum product prices in Europe and Asia-Pacific create export premium opportunities. US refined product exports already hit record levels in 2024 at 6.6 million barrels per day. [30] With European jet fuel in shortage, US jet fuel exports command a geographic premium.
The finding is MECHANISM because the extent of export premium captured depends on logistics constraints, refinery product slate decisions, and shipping availability that are not fully confirmed.
AIRLINES WITH ESTABLISHED FUEL HEDGES
Rating: MECHANISM
Time horizon: Through Q3 2026
Airlines that entered 2026 with established fuel hedging programs, typically purchasing call options or swap contracts on jet fuel at strike prices reflecting the pre-crisis baseline, are insulated from the acute pricing cliff facing unhedged operators. Major carriers including Lufthansa, Delta, and Singapore Airlines have disclosed hedging ratios in the range of 40 to 70 percent of annual fuel consumption. These carriers face elevated fuel costs on their unhedged portion but are substantially protected compared to operators with low or zero hedging ratios. [90] [95]
The benefit here is purely a function of decision timing: carriers that hedged before March 2026 benefit; carriers that reduced hedging during the 2023 to 2025 period of lower oil prices and volatility face the acute pricing exposure.
BUYERS EXPOSED TO SHORTAGE PRICING WITHOUT OFFSETTING REVENUE MECHANISMS
Procurement categories facing the most acute shortage pricing before spot markets adjust are unhedged aviation fuel buyers, small and mid-tier petroleum product distributors without term supply agreements, and import-dependent developing-country fuel buyers relying on spot market procurement. These segments have no benefit from the crisis and face cost structures that may become operationally unsustainable in the June to July 2026 window. Sub-Saharan African and South Asian importers are at particular risk given reliance on Middle East refined product exports that transit the Strait. [17] [19]
Key Risks
RISK 1: BLOCKADE RESOLVES FASTER THAN PRICED
The scenario in which the Strait of Hormuz blockade resolves through diplomatic agreement or military escalation within weeks poses the primary risk to this analysis. If the Strait reopens significantly before August 2026, the physical-futures dislocation collapses, buyers who locked in emergency procurement at elevated prices face stranded cost exposure, and the acute shortage pricing window for European jet fuel and Asian refiners closes before terminal inventories breach the 23-day threshold. The futures market's current pricing at $100 to $102, substantially below physical clearing levels, implies the market assigns non-trivial probability to relatively rapid resolution. [23] [25] [28]
This risk is material and asymmetric: a rapid resolution reverses most of the acute shortage dynamics analyzed here, while a prolonged blockade confirms them. The analysis cannot assign a probability to resolution timing with confidence.
RISK 2: DEMAND DESTRUCTION EXCEEDS CURRENT ESTIMATES
If oil demand elasticity at $140 to $170 per barrel physical prices exceeds the conservative negative 0.2 to 0.3 range assumed in this analysis, demand destruction could offset a larger share of the supply deficit than projected. A 15 to 20 percent demand reduction from a 70 to 90 percent price shock would reduce the net depletion rate to 4 to 6 million barrels per day, extending the inventory timeline substantially and potentially preventing the June threshold breach for European jet fuel if accompanied by simultaneous supply substitution. Airline schedule reductions, industrial fuel switching, and road fuel demand elasticity are all operating mechanisms that may materialize faster than this analysis assumes. [90] [95]
RISK 3: GRADE MISMATCH CONSTRAINT IS MORE BINDING THAN CURRENTLY EVIDENCED
The light sweet crude grade-specific refinery shortage is rated MECHANISM with 60 percent confidence. If empirical data confirms that Japanese, Singaporean, and Northwest European refineries are actually unable to process sour crude at adequate volumes due to configuration constraints, the shortage is more severe and more prolonged than this analysis projects. The upgrade from MECHANISM to CAUSAL for this finding would materially worsen the Asian refinery feedstock outlook and accelerate the timeline to diesel shortage in import-dependent developing countries. This risk is not currently the central case but would significantly alter the sectoral sequence if confirmed.
RISK 4: SPR DELIVERY BOTTLENECKS REDUCE EFFECTIVE RELEASE RATE
If the actual delivery rate of SPR releases to refineries is materially below the authorized program rate due to pipeline constraints, refinery acceptance limitations, or allocation mismatches between crude grade released and refinery grade requirements, the 1 million barrel per day supply offset is further reduced. Specifically, if SPR releases are concentrated in medium sour crude grades that cannot be absorbed by light sweet refineries in shortage regions, the physical supply offset is near zero for the most affected procurement categories despite the nominal release program being in progress. [40] [41] [42]
RISK 5: FUTURES-PHYSICAL CONVERGENCE TIMELINE UNCERTAINTY
This analysis assumes spot market convergence to physical prices occurs within 3 to 4 weeks of the acute shortage peak, based on demand destruction and supply substitution mechanisms. If convergence is delayed, for example because futures market participants maintain their assumption of rapid blockade resolution longer than physical evidence warrants, the period during which Tier 2 buyers renewing contracts face maximum pricing dislocation extends beyond the projected June window. Extended convergence increases total losses to unhedged buyers and raises the probability of demand destruction that permanently shifts energy consumption patterns in affected regions.
What to Watch
EUROPE JET FUEL INVENTORY LEVELS AGAINST 23-DAY IEA THRESHOLD
The single most actionable near-term data point is the weekly reporting of European commercial jet fuel inventories relative to the IEA 23-day critical threshold. The current trajectory points to a breach in June 2026. Any acceleration of this trajectory, either from faster-than-expected demand drawdown or production shortfalls, moves the acute pricing cliff earlier. Any stabilization or deceleration, driven by US export increases or demand destruction from airline capacity reductions, moves it later or avoids it entirely. This data point resolves the most consequential open question in the near-term analysis.
PHYSICAL-FUTURES PRICE SPREAD CONVERGENCE OR DIVERGENCE
The $47 to $77 per barrel spread between Brent futures and physical cargo transactions is the real-time measure of market uncertainty about blockade duration. Narrowing of the spread signals the market pricing in faster resolution. Widening signals the market pricing in extended blockade and more severe physical shortage. The spread should be monitored daily, not weekly, by any entity with procurement decisions in the May to July 2026 window.
STRAIT OF HORMUZ TRANSIT VOLUMES
Weekly data on actual shipping transits through the Strait, available through vessel tracking services, is the leading indicator of whether the blockade is holding, loosening, or tightening. A sustained increase above 2 million barrels per day transit would signal partial reopening and would trigger the blockade-resolves scenario. A further decline below 2 million barrels per day would signal escalation and accelerate the depletion timeline.
OPEC PLUS EMERGENCY PRODUCTION RESPONSE
Saudi Arabia and the UAE have bypass pipeline capacity and spare production capacity. Any OPEC Plus emergency production increase announced in May or June 2026 would partially offset the Strait deficit and should be monitored for both the volume committed and the speed of delivery into global markets. The bypass pipeline capacity utilization rate (East-West Pipeline, Abu Dhabi Crude Oil Pipeline) is a direct physical indicator of bypass relief effectiveness.
US REFINERY CRUDE INPUT MIX AND PRODUCT EXPORT VOLUMES
Weekly EIA data on US refinery crude input by grade and petroleum product export volumes, particularly jet fuel, will indicate whether US production is effectively substituting for the missing Middle East supply in European and Asian markets. A sustained increase in US jet fuel export volumes would moderate the European shortage trajectory materially.
APPENDIX: ANALYSIS LOG
Report ID: NNI-2026-0512-FUEL
Topic: Map the timeline and sectoral sequence of physical fuel supply chain failures driven by crude inventory depletion, identifying which procurement categories and companies face acute shortage pricing before spot market pricing mechanisms fully adjust Published: May 2026 Real-time data gathered: Yes Sources cited: 95 Causal ratings: CAUSAL 3 | MECHANISM 2 | THRESHOLD 1 | CORRELATED 1 Verification agreements: 0 | Overrides: 6
Open questions: GAP_001: Company-specific inventory positions and procurement contract terms, specifically term versus spot ratios by firm and contract maturity schedules for May through June 2026 GAP_002: Regional storage terminal utilization rates and discharge queue depths as of May 2026 at Amsterdam-Rotterdam-Antwerp, Fujairah, and Houston Ship Channel facilities GAP_003: Refinery-specific crude grade preferences and switchability constraints under feedstock stress, including throughput penalty quantification for sour crude substitution at light sweet refineries in Japan, Singapore, and Northwest Europe GAP_004: Quantified price lag duration between inventory signal detection and spot market repricing, specifically whether futures markets are forward-pricing the June shortage or whether the 30 to 45 day lag in spot convergence is empirically supportable GAP_005: Sectoral demand elasticity coefficients and allocation priority protocols during acute shortage, specifically aviation, industrial, and road fuel demand responses at sustained $140 to $170 per barrel physical pricing
Bibliography
[1] Iran war is draining world’s oil buffer at an unprecedented pace | Fortune https://fortune.com/2026/05/09/iran-war-is-global-oil-stockpile-reserves-releases-strategic-petroleum-reserve/ Accessed: 2026-05-12T00:51:54.495536
[2] China, the United States, and Japan hold most strategic oil inventories in 2025 - U.S. Energy Information Administration (EIA) https://www.eia.gov/todayinenergy/detail.php?id=67504 Accessed: 2026-05-12T00:51:54.495536
[3] Goldman Says Global Oil Stocks Approaching Eight-Year Low, Depletion Speed a Concern - Energy News Beat https://energynewsbeat.co/uncategorized/goldman-says-global-oil-stocks-approaching-eight-year-low-depletion-speed-a-concern/ Accessed: 2026-05-12T00:51:54.495536
[4] Oil Supply Shock and Plunging Petroleum Inventories: 2026 Crisis Explained https://discoveryalert.com.au/oil-supply-shock-petroleum-inventories-hormuz-closure-2026/ Accessed: 2026-05-12T00:51:54.495536
[5] Weekly Petroleum Status Report - U.S. Energy Information Administration (EIA) https://www.eia.gov/petroleum/supply/weekly/ Accessed: 2026-05-12T00:51:54.495536
[6] Global Oil Inventory Drawdown Amid Middle East Supply Shock https://discoveryalert.com.au/oil-inventory-drawdown-middle-east-supply-shock-2026/ Accessed: 2026-05-12T00:51:54.495536
[7] Short-Term Energy Outlook - U.S. Energy Information Administration (EIA) https://www.eia.gov/outlooks/steo/ Accessed: 2026-05-12T00:51:54.495536
[8] Chevron CEO, Goldman Sachs warn physical oil shortages could slow global economies https://www.energyconnects.com/news/oil/2026/may/chevron-ceo-warns-oil-shortages-could-slow-global-economies-as-hormuz-disrupted/ Accessed: 2026-05-12T00:51:54.495536
[9] Short Term Energy Outlook: Global Liquid Fuels
https://www.eia.gov/outlooks/steo/report/global_oil.php Accessed: 2026-05-12T00:51:54.495536
[10] Oil Market Report
https://iea.blob.core.windows.net/assets/515f3128-df1a-4d6c-beb4-fd91d2434bef/-14APR2026_OilMarketReport_Free_version1.pdf Accessed: 2026-05-12T00:51:54.495536
[11] Supply chain shortages: What’s at risk in 2026? | Supply Chain Dive https://www.supplychaindive.com/news/scarcity-redefines-the-2026-supply-chain-playbook/810052/ Accessed: 2026-05-12T00:52:05.581105
[12] Supply chain trends in 2026 | Marsh
https://www.marsh.com/en/services/business-interruption-supply-chain/insights/supply-chain-trends.html Accessed: 2026-05-12T00:52:05.581105
[13] Is There a Fuel Shortage in 2026?
https://factually.co/fact-checks/business/is-there-a-fuel-shortage-2b665e Accessed: 2026-05-12T00:52:05.581105
[14] 79 Supply Chain Statistics To Know in 2026 | Tradeverifyd https://tradeverifyd.com/resources/supply-chain-statistics Accessed: 2026-05-12T00:52:05.581105
[15] The Top 10 Supply Chain Risks of 2026 and How to Mitigate Them | NetSuite https://www.netsuite.com/portal/resource/articles/inventory-management/supply-chain-risks.shtml Accessed: 2026-05-12T00:52:05.581105
[16] Soaring gas prices and supply chain disruptions drive up costs across the economy | PBS News https://www.pbs.org/newshour/economy/soaring-gas-prices-and-supply-chain-disruptions-drive-up-costs-across-the-economy Accessed: 2026-05-12T00:52:05.581105
[17] Middle East war shockwaves ripple through Asia-Pacific fuel and supply chains | UN News https://news.un.org/en/story/2026/03/1167167 Accessed: 2026-05-12T00:52:05.581105
[18] How Jet Fuel Shortages and Supply Chain Disruptions is Affecting 2026 Summer Flight Schedules in Europe - Travel And Tour World https://www.travelandtourworld.com/news/article/how-jet-fuel-shortages-and-supply-chain-disruptions-is-affecting-2026-summer-flight-schedules-in-europe/ Accessed: 2026-05-12T00:52:05.581105
[19] Asia-Pacific: Middle East-Linked Fuel Shortages Disrupt Transport, Industry, and Energy Security | Crisis24 https://www.crisis24.com/articles/asia-pacific-middle-east-linked-fuel-shortages-disrupt-transport-industry-and-energy-security Accessed: 2026-05-12T00:52:05.581105
[20] Top supply chain risks and trends to follow in 2026 | Supply Chain Dive https://www.supplychaindive.com/news/supply-chain-risks-trends-outlook-2026/810852/ Accessed: 2026-05-12T00:52:05.581105
[21] Spot Prices for Crude Oil and Petroleum Products
https://www.eia.gov/dnav/pet/pet_pri_spt_s1_d.htm Accessed: 2026-05-12T00:52:17.100759
[22] Crude Oil Prices Today | OilPrice.com
https://oilprice.com/ Accessed: 2026-05-12T00:52:17.100759
[23] Futures vs. physical: How the oil market broke in two - The Berkshire Edge https://theberkshireedge.com/future-vs-physical-how-the-oil-market-broke-in-two/ Accessed: 2026-05-12T00:52:17.100759
[24] Crude oil and petroleum product prices increased sharply in the first quarter of 2026 - U.S. Energy Information Administration (EIA) https://www.eia.gov/todayinenergy/detail.php?id=67424 Accessed: 2026-05-12T00:52:17.100759
[25] Brent crude oil - Price - Chart - Historical Data - News https://tradingeconomics.com/commodity/brent-crude-oil Accessed: 2026-05-12T00:52:17.100759
[26] Crude Oil Market Prices, Data, and Analysis | S&P Global https://www.spglobal.com/energy/en/commodity/oil/crude Accessed: 2026-05-12T00:52:17.100759
[27] EIA expects lower gasoline prices in 2026 and 2027 as crude oil prices fall - U.S. Energy Information Administration (EIA) https://www.eia.gov/todayinenergy/detail.php?id=67024 Accessed: 2026-05-12T00:52:17.100759
[28] Oil Price Forecast for 2026 | J.P. Morgan Global Research https://www.jpmorgan.com/insights/global-research/commodities/oil-prices Accessed: 2026-05-12T00:52:17.100759
[29] Crude Oil - Price - Chart - Historical Data - News https://tradingeconomics.com/commodity/crude-oil Accessed: 2026-05-12T00:52:17.100759
[30] Refinery Capacity Report - U.S. Energy Information Administration (EIA) https://www.eia.gov/petroleum/refinerycapacity/ Accessed: 2026-05-12T00:52:26.231962
[31] U.S. Refinery Utilization and Capacity
https://www.eia.gov/dnav/pet/pet_pnp_unc_dcu_nus_m.htm Accessed: 2026-05-12T00:52:26.231962
[32] US Utilization of Refinery Capacity (Weekly) - Historical D… https://ycharts.com/indicators/us_operable_crude_oil_distillation_capacity Accessed: 2026-05-12T00:52:26.231962
[33] Oil Refinery Statistics in US 2026 | Capacity, Output & Key Facts - The World Data https://theworlddata.com/oil-refinery-statistics-in-us/ Accessed: 2026-05-12T00:52:26.231962
[34] Weekly U.S. Percent Utilization of Refinery Operable Capacity (Percent) https://www.eia.gov/dnav/pet/hist/LeafHandler.ashx?n=PET&s=WPULEUS3&f=W Accessed: 2026-05-12T00:52:26.231962
[35] Refinery closures and their impact on U.S. fuel supply in 2026 - BIC Magazine https://www.bicmagazine.com/industry/refining-petrochem/refinery-closures-and-their-impact-on-us-fuel-supply/ Accessed: 2026-05-12T00:52:26.231962
[36] OPEC Digital Publications - World Oil Outlook
https://publications.opec.org/woo/chapter/142/2642 Accessed: 2026-05-12T00:52:26.231962
[37] Petroleum & Other Liquids Data - U.S. Energy Information Administration (EIA) https://www.eia.gov/petroleum/data.php Accessed: 2026-05-12T00:52:26.231962
[38] U.S. refineries utilization rate 2024| Statista https://www.statista.com/statistics/745378/us-refineries-utilization-rate/ Accessed: 2026-05-12T00:52:26.231962
[39] Oil Refining Market Size, Industry Share | Forecast, 2026-2034 https://www.fortunebusinessinsights.com/oil-refining-market-105698 Accessed: 2026-05-12T00:52:26.231962
[40] History of SPR Releases | Department of Energy
https://www.energy.gov/hgeo/opr/history-spr-releases Accessed: 2026-05-12T00:52:35.166372
[41] Weekly U.S. Ending Stocks of Crude Oil in SPR (Thousand Barrels) https://www.eia.gov/dnav/pet/hist/LeafHandler.ashx?n=PET&s=WCSSTUS1&f=W Accessed: 2026-05-12T00:52:35.166372
[42] DOE has released 17.5 million barrels from the Strategic Petroleum Reserve since March - U.S. Energy Information Administration (EIA) https://www.eia.gov/todayinenergy/detail.php?id=67625 Accessed: 2026-05-12T00:52:35.166372
[43] Strategic Petroleum Reserve (United States) - Wikipedia
https://en.wikipedia.org/wiki/Strategic_Petroleum_Reserve_(United_States) Accessed: 2026-05-12T00:52:35.166372
[44] US Oil Reserves: Strategic Petroleum Reserve Storage & History 2026 https://www.davemanuel.com/us-oil-reserves.php Accessed: 2026-05-12T00:52:35.166372
[45] Strategic Petroleum Reserve | Department of Energy
https://www.energy.gov/hgeo/opr/strategic-petroleum-reserve Accessed: 2026-05-12T00:52:35.166372
[46] Strait of Hormuz - About - IEA
https://www.iea.org/about/oil-security-and-emergency-response/strait-of-hormuz Accessed: 2026-05-12T00:53:41.148303
[47] 2026 Strait of Hormuz crisis - Wikipedia
https://en.wikipedia.org/wiki/2026_Strait_of_Hormuz_crisis Accessed: 2026-05-12T00:53:41.148303
[48] Amid regional conflict, the Strait of Hormuz remains critical oil chokepoint - U.S. Energy Information Administration (EIA) https://www.eia.gov/todayinenergy/detail.php?id=65504 Accessed: 2026-05-12T00:53:41.148303
[49] The Middle East and Global Energy Markets – Topics - IEA https://www.iea.org/topics/the-middle-east-and-global-energy-markets Accessed: 2026-05-12T00:53:41.148303
[50] Strait of Hormuz Oil Blockade Driving $100 Crude Oil in 2026 https://discoveryalert.com.au/strait-hormuz-oil-blockade-100-crude-price-2026/ Accessed: 2026-05-12T00:53:41.148303
[51] 2026 Iran war fuel crisis - Wikipedia
https://en.wikipedia.org/wiki/2026_Iran_war_fuel_crisis Accessed: 2026-05-12T00:53:41.148303
[52] Iran Conflict and the Strait of Hormuz: Impacts on Oil, Gas, and Other Commodities | Congress.gov | Library of Congress https://www.congress.gov/crs-product/R45281 Accessed: 2026-05-12T00:53:41.148303
[53] Oil Market Report - April 2026 – Analysis - IEA https://www.iea.org/reports/oil-market-report-april-2026 Accessed: 2026-05-12T00:53:41.148303
[54] Economic impact of the 2026 Iran war - Wikipedia https://en.wikipedia.org/wiki/Economic_impact_of_the_2026_Iran_war Accessed: 2026-05-12T00:53:41.148303
[55] Crude Oil Overview - CME Group
https://www.cmegroup.com/markets/energy/crude-oil/light-sweet-crude.html Accessed: 2026-05-12T00:53:41.148303
[56] Sweet vs. sour? These are the differences in the types of crude oil https://www.marketplace.org/story/2026/04/10/what-are-the-differences-in-crude-oil Accessed: 2026-05-12T00:53:41.148303
[57] Crude Oil Price Today (11th May, 2026): Crude Oil Rate, Brent Futures & Price Chart - Goodreturns https://www.goodreturns.in/crude-oil-price.html Accessed: 2026-05-12T00:53:41.148303
[58] 2026 Oil Outlook: US Peak, China Stocks & OPEC+ Strategy Crude oil: Top 5 market drivers in 2026 | Kpler - Jan 14, 2026 https://www.kpler.com/blog/crude-oil-top-5-market-drivers-in-2026 Accessed: 2026-05-12T00:53:41.148303
[59] Light Sweet vs Heavy Sour Crude | Quality and Price Spreads | [Updated 2026] https://www.alphaexcapital.com/commodities/energy-commodities/crude-oil-trading/light-sweet-vs-heavy-sour-crude Accessed: 2026-05-12T00:53:41.148303
[60] Understanding the Differences: Light Sweet Crude Oil vs. Heavy Sour Crude Oil https://uscfinvestments.substack.com/p/understanding-the-differences-light Accessed: 2026-05-12T00:53:41.148303
[61] WTI Crude Oil Futures Contracts | Oilprice.com
https://oilprice.com/futures/wti/ Accessed: 2026-05-12T00:53:41.148303
[62] Outlook 2026: Crude on crude – How shale oil flipped the script on the global barrel https://pemedianetwork.com/petroleum-economist/articles/trading-markets/2025/outlook-2026-crude-on-crude-how-shale-oil-flipped-the-script-on-the-global-barrel/ Accessed: 2026-05-12T00:53:41.148303
[63] Types of Crude Oil: Heavy vs Light, Sweet vs Sour, and TAN count | Kimray https://kimray.com/training/types-crude-oil-heavy-vs-light-sweet-vs-sour-and-tan-count Accessed: 2026-05-12T00:53:41.148303
[64] May 2026 Crude Oil Future futures price chart, trading May 2026 Crude Oil Future with FxPro https://www.fxpro.com/trading/futures/usoil_k26 Accessed: 2026-05-12T00:53:52.284205
[65] Crude Oil WTI Futures Contracts - Investing.com
https://www.investing.com/commodities/crude-oil-contracts Accessed: 2026-05-12T00:53:52.284205
[66] Crude Oil WTI May '26 Futures Price - Barchart.com https://www.barchart.com/futures/quotes/CLK26 Accessed: 2026-05-12T00:53:52.284205
[67] Crude Oil (CLW00) Future Contract Prices & News - Google Finance https://www.google.com/finance/beta/quote/CLW00:NYMEX?hl=en Accessed: 2026-05-12T00:53:52.284205
[68] Crude Oil Expiry Date 2026: Factors That Can Affect Crude Oil Prices https://groww.in/blog/crude-oil-futures-and-options-expiry Accessed: 2026-05-12T00:53:52.284205
[69] Crude Oil Futures Calendar - CME Group
https://www.cmegroup.com/markets/energy/crude-oil/light-sweet-crude.calendar.html Accessed: 2026-05-12T00:53:52.284205
[70] Options Expiration Calendar 2026 | Monthly OpEx, Weekly & LEAPS Dates https://cutemarkets.com/expiration-calendar Accessed: 2026-05-12T00:53:52.284205
[71] Supply Chain Brief: Memory Market Conditions in 2026 | VersaLogic https://www.versalogic.com/blog/supply-chain-brief-memory-market-conditions-in-2026/ Accessed: 2026-05-12T00:53:52.284205
[72] What Is OpEx in Stocks? Options Expiration Guide 2026 https://www.financialtechwiz.com/post/what-is-opex-in-stocks/ Accessed: 2026-05-12T00:53:52.284205
[73] Futures Contract Rollover Guide [Updated April 2026]
https://www.tradingsim.com/blog/futures-contracts-rollover Accessed: 2026-05-12T00:53:52.284205
[74] Contract Expiry Times | May 2026 1 © 2026 Intercontinental Exchange, Inc. https://www.ice.com/publicdocs/futures/ICE_Futures_Contract_Expiry_Times.pdf Accessed: 2026-05-12T00:53:52.284205
[75] 2026 options - expiration calendar https://cdn.cboe.com/resources/options/Cboe2026OPTIONSCalendar.pdf Accessed: 2026-05-12T00:53:52.284205
[76] Futures Expiration Calendar - Investing.com
https://www.investing.com/futures-expiration-calendar/ Accessed: 2026-05-12T00:53:52.284205
[77] 2026 Expiration Calendar
https://www.optionseducation.org/getmedia/78d096fb-a61e-4120-b84a-35b631b58c4b/2026-Expiration-Calendar-12-16-FINAL.pdf?ext=.pdf Accessed: 2026-05-12T00:53:52.284205
[78] Tradealgo
https://www.tradealgo.com/trading-guides/futures/futures-market-hours-expiration Accessed: 2026-05-12T00:53:52.284205
[79] Option expiration calendar 2026: Monthly, Weekly & Quarterly Dates for Traders https://marketxls.com/blog/option-expiration-calendars-a-guide-for-traders Accessed: 2026-05-12T00:53:52.284205
[80] Data Center Outlook: Half of 2026 Pipeline May Not Materialize https://www.sightlineclimate.com/research/data-center-outlook Accessed: 2026-05-12T00:54:03.546727
[81] MarineTraffic product updates: May 2025 Maritime product updates: Proactive compliance, live incident intelligence, and smarter terminal monitoring | Kpler - May 11, 2026 https://www.kpler.com/blog/maritime-product-updates-proactive-compliance-live-incident-intelligence-smarter-terminal-monitoring Accessed: 2026-05-12T00:54:03.546727
[82] 2026 Container Shipping Market Outlook: Rates, Capacity & Trends https://www.foursonslogistics.com/blog/2026-container-shipping-market-outlook/ Accessed: 2026-05-12T00:54:03.546727
[83] May 2026 Container Sourcing: Shutdowns & Logistics Arbitrage — Muwon USA, Inc. https://www.muwon-usa.com/market-insights/may-2026-the-last-dislocation-window Accessed: 2026-05-12T00:54:03.546727
[84] Port operational updates from around the world (1 -8 January 2026) https://mykn.kuehne-nagel.com/news/article/port-operational-updates-from-08-01-2026 Accessed: 2026-05-12T00:54:03.546727
[85] Pipeline Egress Outlook to 2030 - 2026 Edition | Oil Sands Magazine https://www.oilsandsmagazine.com/market-insights/2025/12/11/pipeline-egress-outlook-to-2030-2026-edition Accessed: 2026-05-12T00:54:03.546727
[86] Natural Gas Data - U.S. Energy Information Administration (EIA) https://www.eia.gov/naturalgas/data.php Accessed: 2026-05-12T00:54:03.546727
[87] Optimal utilization of natural gas pipeline storage capacity under future supply uncertainty - ScienceDirect https://www.sciencedirect.com/science/article/abs/pii/S0098135419312529 Accessed: 2026-05-12T00:54:03.546727
[88] Freight Market Update: May 2026 | C.H. Robinson
https://www.chrobinson.com/en-us/resources/insights-and-advisories/north-america-freight-insights/may-2026-freight-market-update/ Accessed: 2026-05-12T00:54:03.546727
[89] Europe’s jet fuel supplies should fall below the key 23-day shortage threshold in June, so plan your travel accordingly | Fortune https://fortune.com/2026/05/06/europe-jet-fuel-fall-below-23-day-shortage-threshold/ Accessed: 2026-05-12T00:54:03.546727
[90] What lagging jet fuel supplies could mean for airlines and travelers | PBS News https://www.pbs.org/newshour/economy/what-lagging-jet-fuel-supplies-could-mean-for-airlines-and-travelers Accessed: 2026-05-12T00:54:03.546727
[91] April 2026 Short-Term Energy Outlook
https://www.eia.gov/outlooks/steo/archives/apr26.pdf Accessed: 2026-05-12T00:54:03.546727
[92] Iran war threatens jet fuel shortage that could disrupt summer travel in Asia and Europe https://www.cnbc.com/2026/05/06/iran-war-jet-fuel-europe-asia-summer-flights.html Accessed: 2026-05-12T00:54:03.546727
[93] Europe braces for severe jet fuel crunch before summer rush - Cirium https://www.cirium.com/thoughtcloud/europe-braces-for-severe-jet-fuel-crunch-before-summer-rush/ Accessed: 2026-05-12T00:54:03.546727
[94] Flying soon? What the jet fuel crisis means for travellers and airlines | Euronews https://www.euronews.com/travel/2026/04/17/flying-soon-what-the-jet-fuel-crisis-means-for-travellers-and-airlines Accessed: 2026-05-12T00:54:03.546727
[95] The jet-fuel surge is making global flight connections disappear | Fortune https://fortune.com/2026/04/18/jet-fuel-surge-shortage-oil-prices-iran-war-flight-connections-airline-capacity/ Accessed: 2026-05-12T00:54:03.546727
Causal Relationship Graph
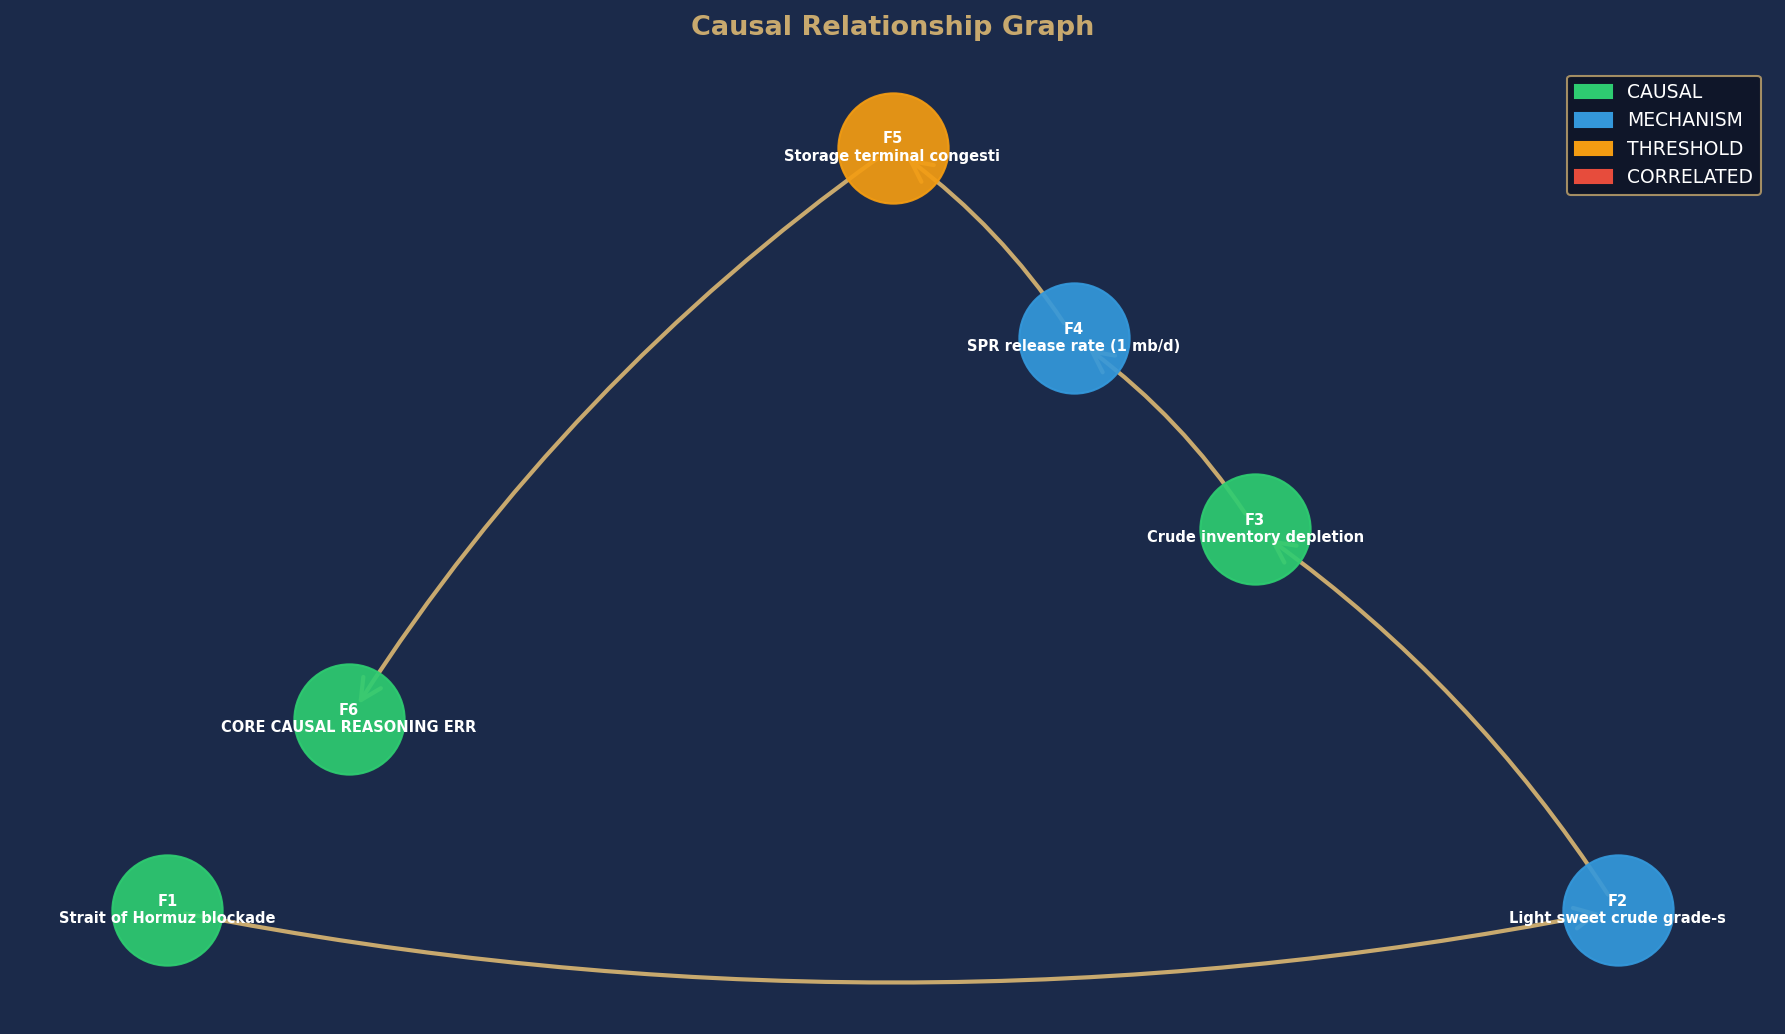
Node colors indicate causal confidence rating. Arrows show directional causal relationships identified in this analysis.
Finding Confidence Distribution
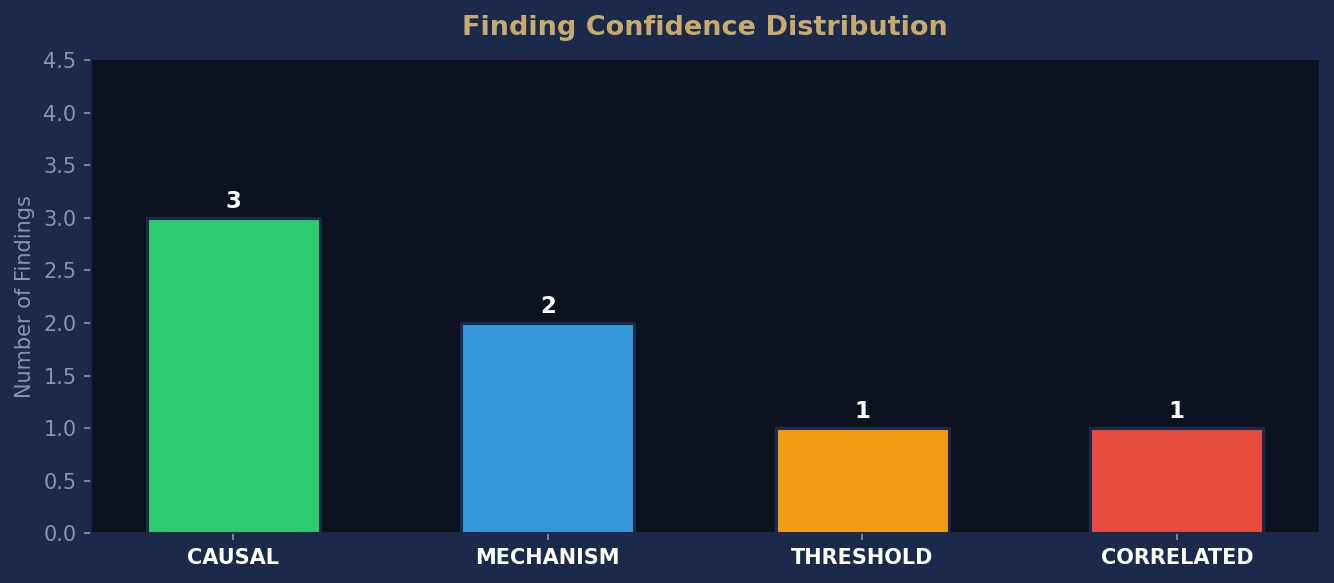
Distribution of causal confidence ratings across all findings in this report. CAUSAL findings are fully actionable. MECHANISM findings require additional evidence before action.
This report was published on May 12, 2026. By the time it's free, the market has already moved.
Don't miss the next one.
Don't miss the next one.
This report was published May 12, 2026. Current intelligence reports are available now.